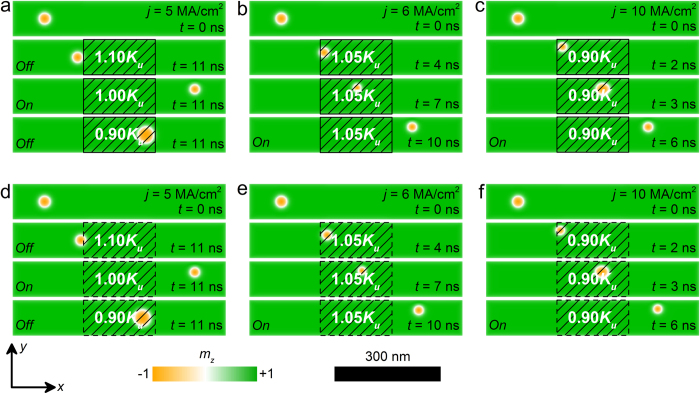
Figure 2. The top-view of the nanotracks under different spin current density j as well as different voltage-controlled PMAs Kuv in the voltage-gated region with sharp transition profile at selected times.
: (a) j = 5 MA/cm2, Kuv = 1.1 Ku, 1.0 Ku or 0.9 Ku; (b) j = 5 MA/cm2, Kuv = 1.05 Ku; (c) j = 10 MA/cm2, Kuv = 0.9 Ku. The top-view of the nanotracks under different j and Kuv in the voltage-gated region with smooth transition profile at selected times: (d) j = 5 MA/cm2, Kuv = 1.1 Ku, 1.0 Ku or 0.9 Ku; (e) j = 5 MA/cm2, Kuv = 1.05 Ku; (f) j = 10 MA/cm2, Kuv = 0.9 Ku. The colour scale denotes the out-of-plane component of the magnetization. The black-line shadows represent the voltage-controlled PMA region.

