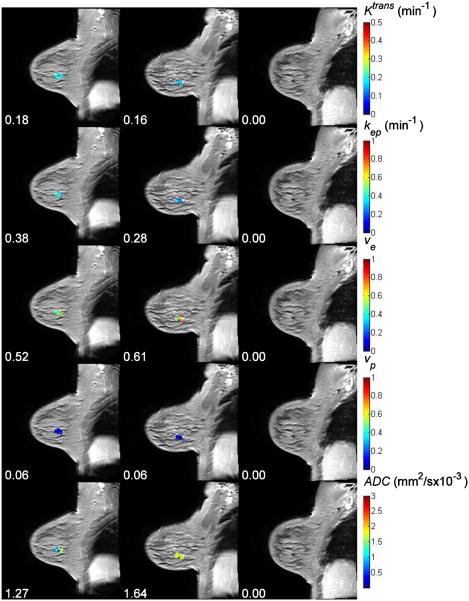
Figure 1.
The averaged post-contrast MR images with Ktrans, kep, ve, vp, and ADC maps superimposed at three time points (three columns) for one pathological complete responder. The numbers under panels are the mean values for Ktrans, kep, ve, vp, and ADC at different time points. For this complete responder, both the mean Ktrans and the mean kep were decreased after one cycle of therapy, while the mean values of ve, vp, and ADC were increased.

