
Figure 4.
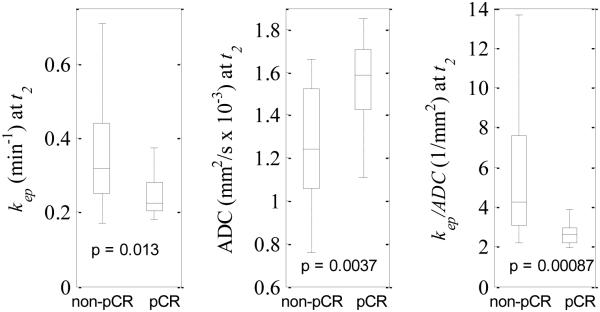
Boxplots of kep (left panel), ADC (middle panel), and kep/ADC (right panel) at t2 for non-pCRs and pCRs. The central marks show the median and the edges of the box are the 25th and 75th percentiles. Outliers are not shown in the figure. The medians of kep for non-pCRs and pCRs were 0.32 min−1 and 0.23 min−1, respectively, while they were 1.24 mm2/s × 10−3 and 1.59 mm2/s × 10−3 for ADC, and 4.27 1/mm2 and 2.63 1/mm2 for kep/ADC, respectively.