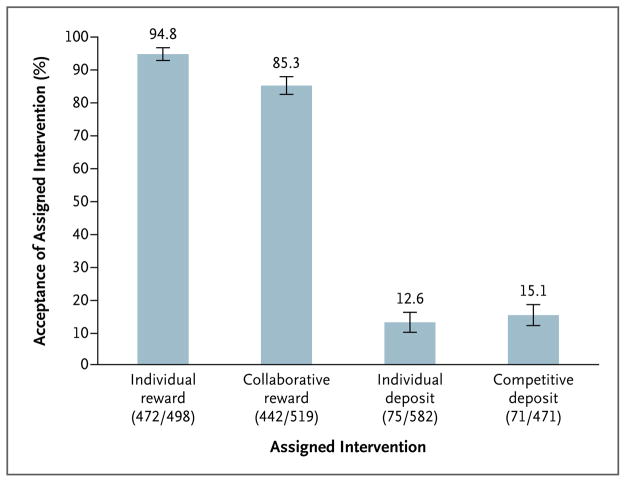
Figure 2. Acceptance Rates of Financial-Incentive Structures.
Acceptance rates were adjusted for two stratifying variables30: whether participants received their health insurance through CVS Caremark and whether their annual household income was at least $60,000 or less than $60,000. I bars denote 95% confidence intervals. In parentheses, the numerator indicates the number of participants accepting each intervention, and the denominator indicates the number of participants assigned to each intervention. The usual-care group is not shown, because there was no option to decline usual care.

