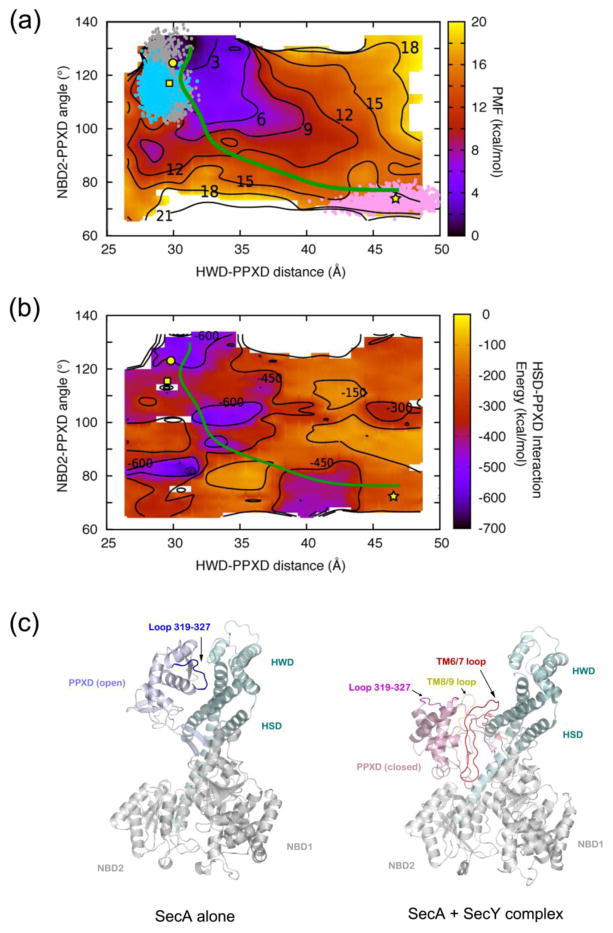
Figure 2. Free energy analysis of clamp movements.
(a) The potential of mean force (PMF) of T. maritima SecA was calculated for clamp closure as a function of the HWD-PPXD distance (x-axis) and the PPXD-hinge-NBD2 angle (y-axis). The PMF is presented as a heat map ranging from dark purple (lowest energy) to bright yellow (highest energy). Also shown are contour lines for the indicated energy values (in kcal/mol). The scale is shown on the right. Structures of T. maritima SecA reported in this study (square), PDB 3JUX (circle), and PDB 3DIN (star) are mapped at corresponding positions. Points shown in cyan (new structure), gray (PDB 3JUX), and pink (SecA in PDB 3DIN) give the regions of conformational space sampled in equilibrium simulations starting from crystal structures. The green line represents the least-free-energy path connecting the open and closed clamp conformations of SecA.
(b) The PPXD-HSD interaction energy was calculated for clamp closure as a function of the HWD-PPXD distance (x-axis) and PPXD-hinge-NBD2 angle (y-axis). PPXD-HSD interaction energy is shown as a heat map ranging from dark purple (lowest energy) to bright yellow (highest energy), with the scale given on the right. Contour lines of constant energy in kcal/mol are also shown. Structures of SecA are mapped into the diagram by symbols as in (a). The minimum-energy path is shown in green.
(c) Binding SecY to SecA (right panel) interferes with the interaction between PPXD and HSD/HWD seen in the open clamp conformation of SecA in isolation (left panel). PPXD is colored light purple and pink in the open and closed conformations, respectively. HSD and HWD domains are shown in cyan, and the TM6/7 and TM8/9 loops of SecY in red and yellow, respectively. PPXD loop 319-327 binds to HSD in the open conformation (in blue) and moves outwards in the SecY-bound state (shown in magenta).

