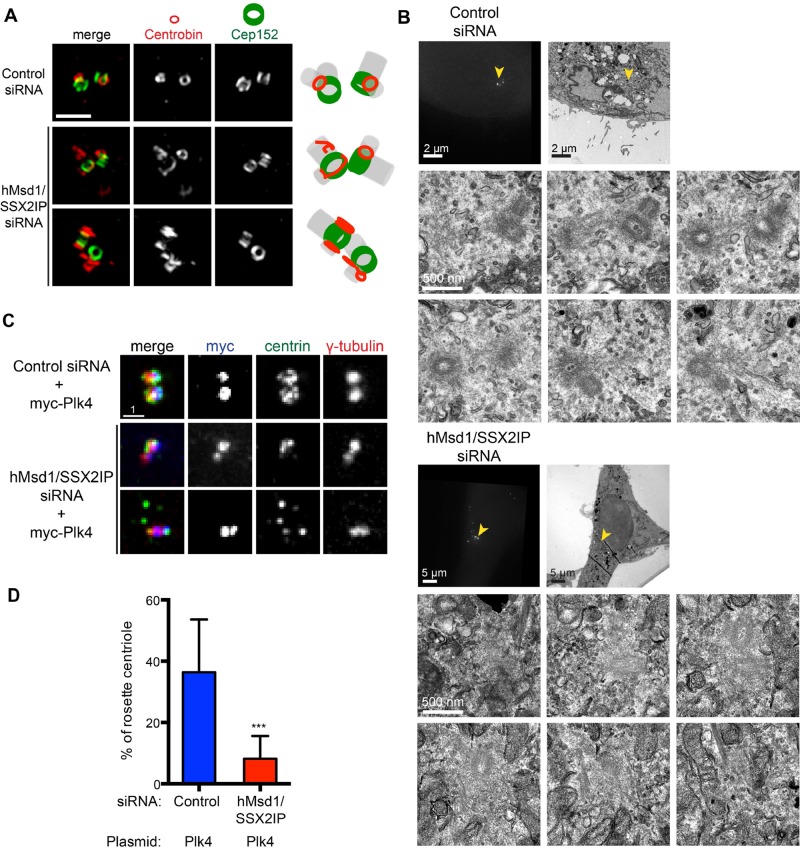
FIGURE 5:
Centriole structures are abnormal in hMsd1/SSX2IP-depleted cells. (A) Superresolution microscopy (OMX) images. Representative images show two normal ring structures of Cep152 in either control (top) or after hMsd1/SSX2IP depletion (bottom two rows), whereas centrobin displays abnormal non-ring structures in hMsd1/SSX2IP-depleted cells. In control cells, centrobin forms smaller rings juxtaposed with Cep152 rings (>20 cells, n = 2). Right, schematics depicting the localization patterns of centrobin and Cep152 together with predicted centriole structures (gray). Scale bar, 1 μm. (B) CLEM images. HeLa cells stably expressing centrin-GFP were transfected with control or hMsd1/SSX2IP siRNA and processed for CLEM analysis. Top row, correlative images of fluorescence (left) and EM (right). Bottom two rows, serial section images corresponding to the areas marked with yellow arrowheads in the top row (control siRNA n = 6, hMsd1/SSX2IP siRNA n = 12). Note that distinctive electron-dense centriole structures were more difficult to identify in the hMsd1/SSX2IP-depleted cells. Scale bars, 2 μm, 5 μm (top), 500 nm (bottom two rows). (C) Loss of hMsd1/SSX2IP suppresses the appearance of a rosette-like arrangement of extra centrins induced by myc-Plk4 overproduction. U2OS cells were transfected with control or hMsd1/SSX2IP siRNA, and plasmids containing myc-connected Plk4 constructs were further transfected after 24 h. Cells were stained with antibodies against myc (blue), centrin-2 (green), and γ-tubulin (red). Representative images of rosette formation in control siRNA cells (top) and two examples in hMsd1/SSX2IP siRNA cells (bottom two rows). One (middle) displays two to four centrin foci, whereas the other (bottom) exhibits the dispersed appearance of extra centrin foci, the phenotype reminiscent of hMsd1/SSX2IP depletion. Scale bar, 1 μm. (D) Quantification of cells containing a rosette-like arrangement of extra centrins. Data represent the mean ± SD (>200 cells, n = 2). ***p < 0.0001.

