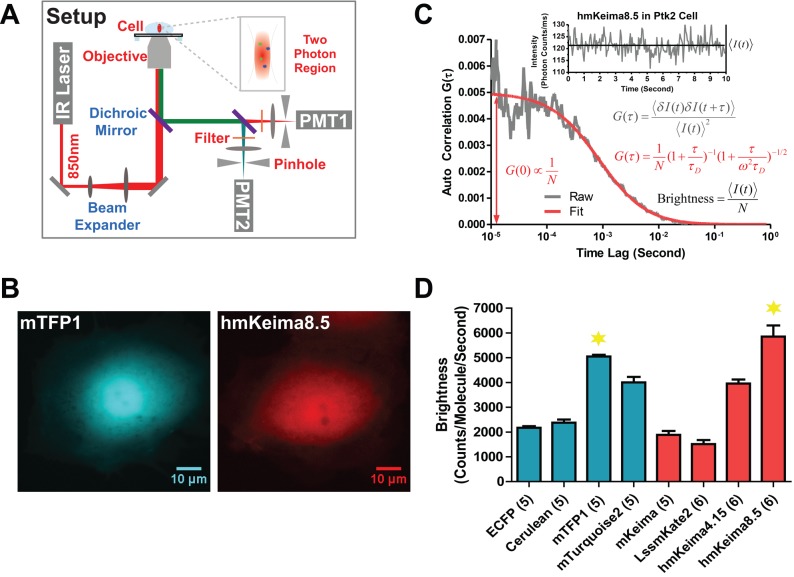
FIGURE 2:
Intracellular molecular brightness of 2P-excitable FPs. (A) Schematic of 2PE-FCS/FCCS setup. A Ti:sapphire femtosecond laser (tuned to 850 nm) is focused into the cellular cytoplasm through a high–numerical aperture objective. The fluorescence from the sample is collected back through the same objective and separated by a dichroic mirror to two detectors (photomultiplier tubes [PMTs]). Two-photon absorption reduces the excitation volume to <1 fl, <0.1% of the cell volume. (B) Fluorescence images of mTFP1 and hmKeima8.5 under identical excitation in individual cells. (C) FCS calculation. The autocorrelation algorithm is applied to fluctuating fluorescence signals, generating the FCS curve (in gray), G(τ). The fitting results (in red) yield the diffusion coefficient D (derived from the characteristic decay time) and the average molecular number N (derived from the inverse of the amplitude, G(0)). The average molecular brightness is obtained by average intensity <I(t)> divided by N. (D) Comparison of intracellular molecular brightness for cyan FPs and mKeima mutants as measured by FCS. mTFP1 and hmKeima8.5 were chosen for further characterization.

