FIGURE 3:
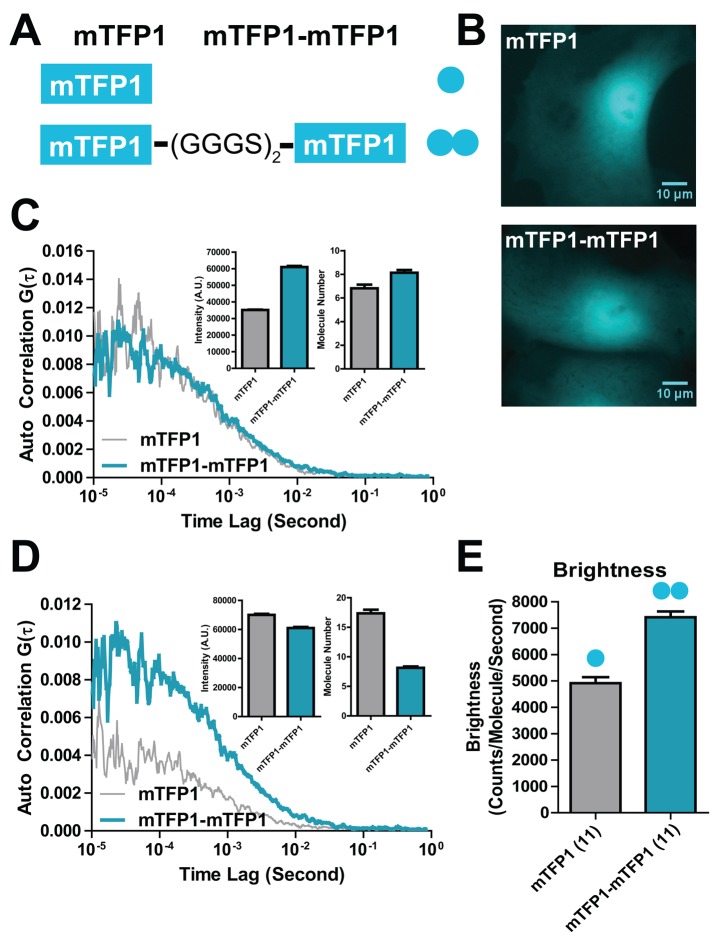
Intracellular single-color FCS calibration. (A) mTFP1 monomer and mTFP1-mTFP1 tandem dimer (GGGSGGGS linker) constructs. (B) Fluorescence image of mTFP1 monomer in single cells and fluorescence image of mTFP1-mTFP1 tandem dimer in single cells. (C) Representative intracellular FCS curves from cells with similar molecular number of mTFP1 and mTFP1-mTFP1. Insets show similar molecular number, but the intensity of mTFP1-mTFP1 cells is about double that of mTFP1. (D) Representative intracellular FCS curves from cells with similar fluorescence intensities of mTFP1 and mTFP1-mTFP1. Insets show similar fluorescence intensity, but the molecular number of mTFP1-mTFP1 cells is about half that of mTFP1. (E) Comparison of average intracellular molecular brightness of mTFP1 and mTFP1-mTFP1.

