FIGURE 1:
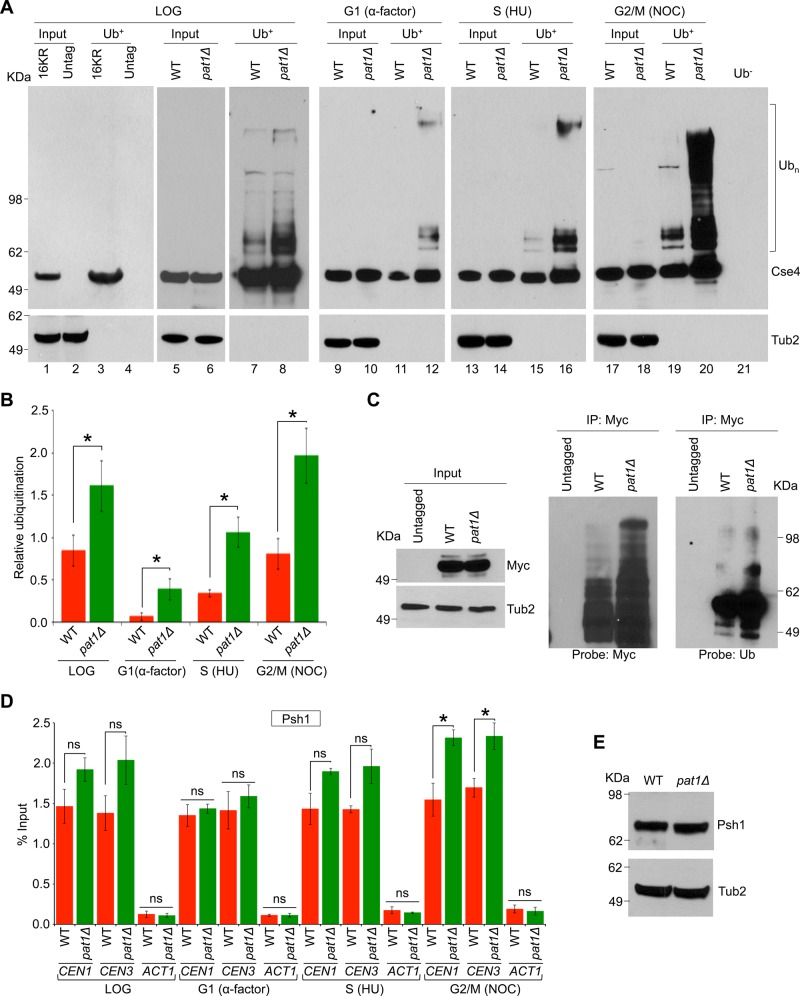
Cse4 ubiquitination is cell cycle dependent and is increased in pat1Δ strains. (A) Cell cycle–dependent ubiquitination of Cse4, which is increased in a pat1Δ strain. Western blotting showing the levels of Cse4 ubiquitination (Ubn) in wild-type (WT, YMB6398) and pat1Δ (YMB8422) strains in cells grown to different stages of the cell cycle: logarithmic phase (LOG), G1 cells synchronized with α-factor, S phase cells synchronized with (HU), and G2/M cells synchronized with nocodazole (NOC). Wild-type strain with mutant cse416KR in which all lysine residues are changed to arginine (16KR; Au et al., 2013) and an untagged strain (untag; YPH499) were used as control in ubiquitin pull-down experiments. Eluted proteins were analyzed by Western blotting with α-Myc (Cse4) or α-Tub2 (served as a loading control) antibodies. Molecular weight markers for protein size in kilodaltons. (B) Quantification of relative ubiquitination of Cse4 in different cell cycle stages. Ratio of ubiquitinated Cse4 (bracket in A) to the total Cse4 levels (input) in WT and pat1Δ strains was calculated. The histogram represents the average of three biological replicates with SE. *p < 0.05, Student's t test. Statistically significant differences were observed between G1 and S or G2/M phases of the cell cycle in WT (p values: G1 vs. S, 0.004; G1 vs. G2/M, 0.008; S vs. G2/M, 0.034) and pat1Δ (p values: G1 vs. S, 0.019; G1 vs. G2/M, 0.005; S vs. G2/M, 0.037) strains. (C) Ubiquitination of Cse4 is increased in a pat1Δ strain. Western blotting showing the levels of Cse4 ubiquitination in wild-type (WT, YMB6398), pat1Δ (YMB8422), and untagged control (YPH499) strains grown to logarithmic phase of growth. Endogenously expressed Cse4-Myc was immunoprecipitated. Eluted proteins were analyzed by Western blotting with α-Myc (Cse4), α-Ub, or α-Tub2 (served as a loading control) antibodies. Molecular weight markers for protein size in kilodaltons. (D) Association of Psh1 with CEN chromatin through the cell cycle. ChIP-qPCR showing the levels of Psh1 in WT (YMB8126) and pat1Δ (YMB9096) strains at CEN (CEN1, CEN3) and non-CEN (ACT1) regions. Enrichment was determined by qPCR and is shown as percentage input. Average from three biological experiments ± SE . *p < 0.05; ns, statistically not significant, Student's t test. (E) Western blotting using α-TAP antibodies revealed that protein levels of Psh1 are not different between WT (YMB8126) and pat1Δ (YMB9096) strains. Molecular weight markers for protein size in kilodaltons.

