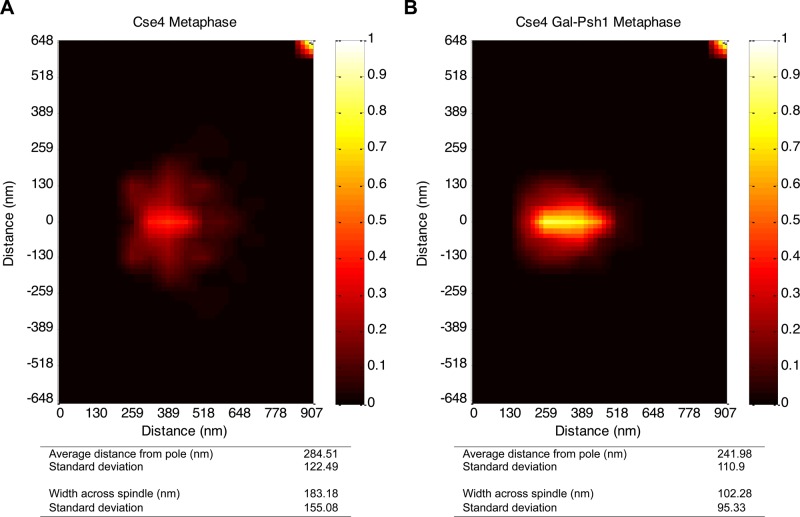
FIGURE 7:
Induction of Psh1 causes structural alterations of Cse4 at kinetochores. Statistical probability map from experimental images representing kinetochore-associated Cse4 upon PSH1 induction in a WT (KBY2012) strain. Statistical analysis of images is shown at the bottom. Distance from the spindle pole is the average distance. The width across the spindle is obtained by adding the average distances below and above the spindle axis. The detailed procedure used to prepare statistical probability maps was described previously (Haase et al., 2013). (A) Experimental statistical probability map for Cse4 in a WT strain without PSH1 induction. Map was generated from 208 images. (B) Experimental statistical probability map for Cse4 in a WT strain with PSH1 induction (GALPSH1). Map was generated from 204 images.

