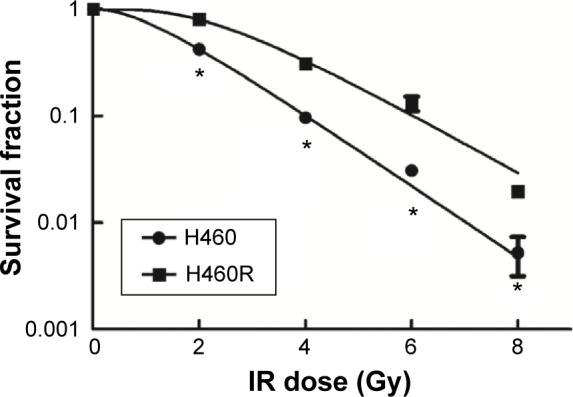
Figure 1.

Analysis of radiosensitivity via clonogenic assay.
Notes: A single-hit multitarget model was used to draw dose–survival curves. The dose–survival curve of H460R cells exhibited a broader initial shoulder (indicating increase in Dq) and a smaller slope rate (indicating increase in D0). H460R cells were more resistant to cell death post-IR at each dose tested. *P<0.05 vs H460 cells at each dose tested.
Abbreviations: H460R, radioresistant H460; IR, irradiation.
