
Figure 4.
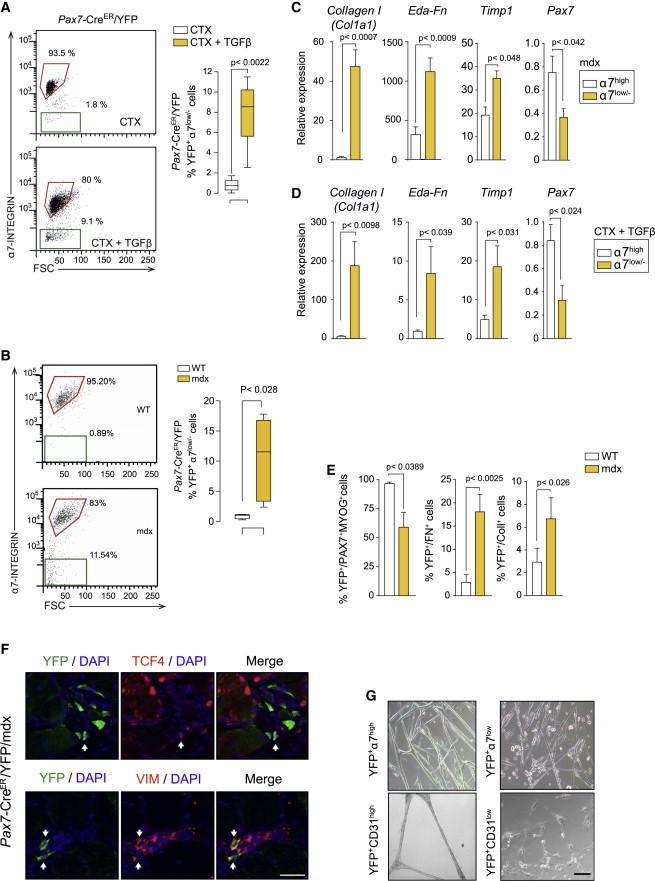
Fibrogenic Plasticity of Satellite Cells at Advanced Muscular Dystrophy Stages and in Response to TGFβ
(A) Representative FACS plots of α7-INTEGRIN expression in CTX-injured and CTX/TGFβ-injured Pax7-CreER/YFP muscles (as in Figure S1F) and quantification of YFP+ cells that have reduced/lost α7-integrin expression. Values are mean ± SEM; n = 6 animals for each group. Non-parametric Mann-Whitney U test was used for comparison.
(B) Quantification of YFP+ cells that maintain or have reduced/lost α7-INTEGRIN expression in Pax7-CreER/YFP/mdx (mdx) mice compared to Pax7-CreER/YFP (WT) mice. Values are mean ± SEM; n = 6 animals for each group. Non-parametric Mann-Whitney U test was used for comparison.
(C and D) qRT-PCR of fibroblastic and myogenic markers in YFP+α7low/− compared to YFP+α7high cells from Pax7-CreER/YFP/mdx muscle (C) and from CTX/TGFβ-injured Pax7-CreER/YFP muscle (D). Values are mean ± SEM; n = 3 independent experiments (mice) for each group. Unpaired t test was used for comparison.
(E) Percentage of YFP+ cells that express myogenic and fibrogenic markers in single fibers from Pax7-Cre/YFP/mdx (mdx) mice compared to Pax7-Cre/YFP (WT) mice. Values are mean ± SEM; n = 5 animals each group. Non-parametric Mann-Whitney U test was used for comparison.
(F) Representative immunostaining shows YFP+ cells co-expressing fibrogenic markers in Pax7-CreER/YFP/mdx mice. Scale bars, 25 μm.
(G) Myogenic potential of FACS-isolated YFP+α7high cells from aged Pax7-Cre/YFP/mdx mice, compared to YFP+α7low/− cells, after culture in DM for 4 days. The angiogenic potential of CD31high versus CD31low/− endothelial cells was similarly determined in angiogenic-promoting conditions (see Experimental Procedures). Scale bars, 50 μm.