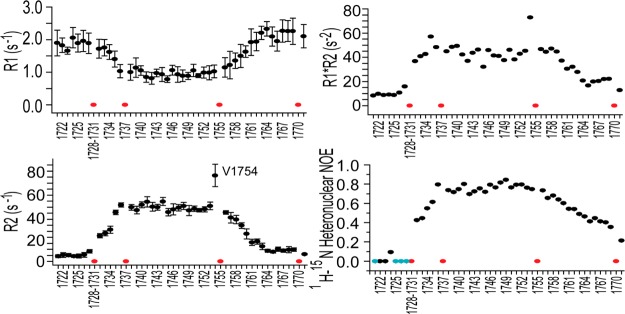
Figure 2.

15N NMR relaxation measurements recorded on a 900 MHz magnet reveal the global dynamics of the Notch1 TM/JM segment in 15% DMPC/DH6PC bicelles (q = 0.33) at pH 5.5 and 318 K. R1 is the longitudinal relaxation rate, and R2 is the transverse relaxation rate. Error bars give the uncertainty associated with the fits of the relaxation decays to yield the reported values. Cyan circles represent peaks with negative values; red circles represent either proline sites or instances in which extensive peak overlap prevented the determination of a reliable value. Additional discussion of the surprsingly high R1R2 plateau for the TM domain is found in the Supporting Information.
