
Figure 1.
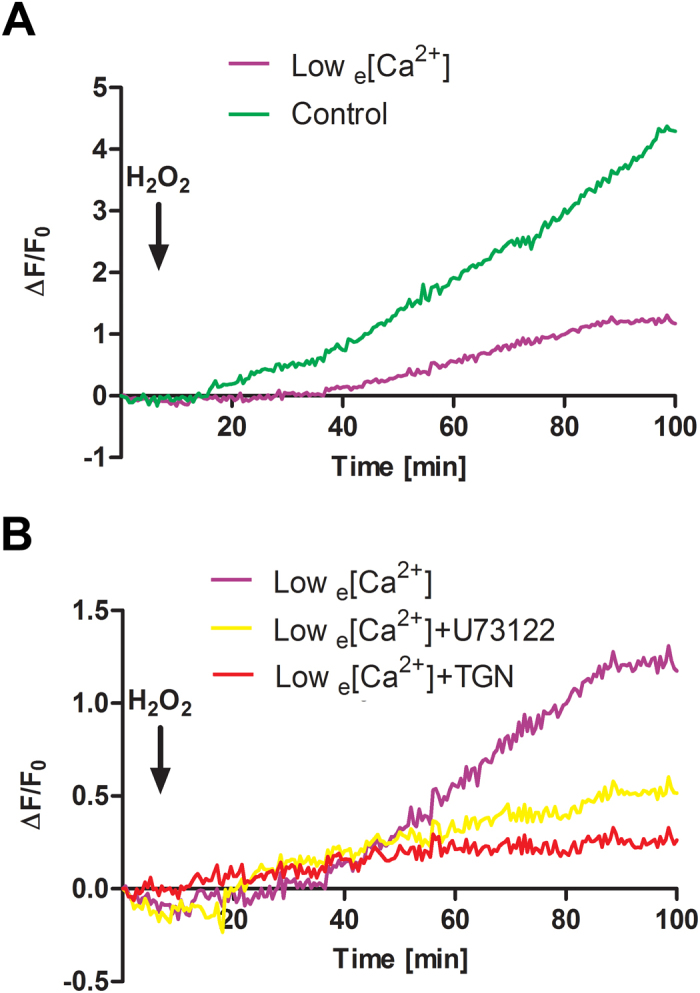
Extracellular Ca2+ is a principal source of [Ca2+]i in osteocytes under OS. (A) MLO-Y4 cells were pre-loaded with 5 μmol·L−1 Fluo-4 dye and then treated with 0.3 mmol·L−1 H2O2 in the presence (control, green line), or absence (low e[Ca2+], purple line) of extracellular Ca2+. (B) MLO-Y4 cells were pre-loaded with Fluo-4 dye and then pre-treated with 5 μmol·L−1 U73122 (yellow line), 0.1 μmol·L−1 thapsigargin (TGN, red line) or non-treatment control (purple line) in the absence of extracellular Ca2+ prior to the treatment with 0.3 mmol·L−1 H2O2. Time laps recording of Ca2+ signal took place every 30 s during entire 100 min time period. The black arrow indicates the moment when H2O2 was added. The lines correspond to an average of 3 independent experiments where 30 cells were quantified and normalized with non-stimulated rest state. The error bars were omitted in order to clearly show the Ca2+ signal pattern.