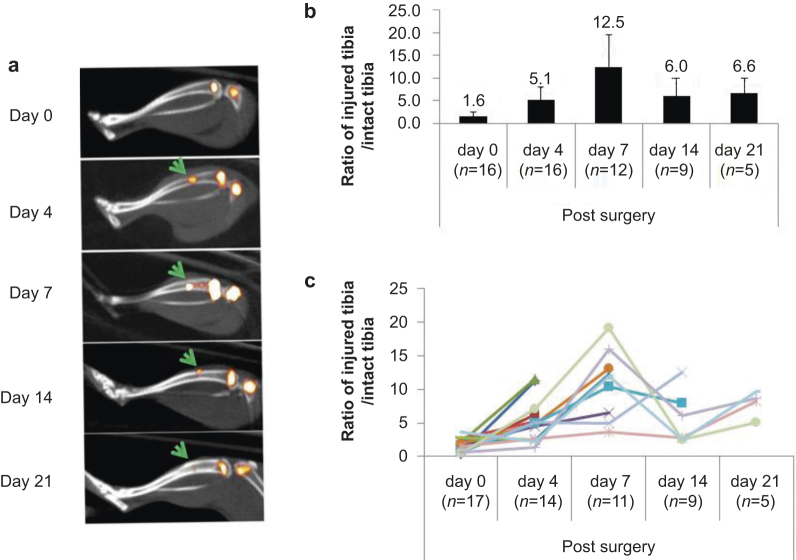
Figure 3.
99mTc-MDP uptake rate peaks at 7 days post injury. (a) Representative SPECT/CT images of injured tibias at each time point. Yellow pseudo color represents the intensity of 99mTc-MDP uptake. Note the growth-plate region in femurs and tibiae showed high 99mTc-MD intensity. The arrows indicate the injury sites; (b) Quantitated 99mTc-MDP uptake at the injury sites, which was normalized to the equivalent position of the intact tibia from the same animal. Each value is significantly changed (P <0.05) compared with previous one except the last time point. n, mouse number used for SPECT/CT scans; (c) 99mTc-MDP uptake at the injury sites from each mouse throughout the healing process. Each line represents an individual animal.

