
Figure 3.
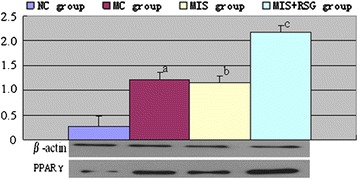
Changes of PPARγ protein expression among different groups (OD value, ).a The PPARγ protein increased significantly compared to the NC group, P < 0.05; b Decreased significantly in the MIS group compared to the MC group, P < 0.05; c Increased significantly compared to the MIS group or MC group, P < 0.05.