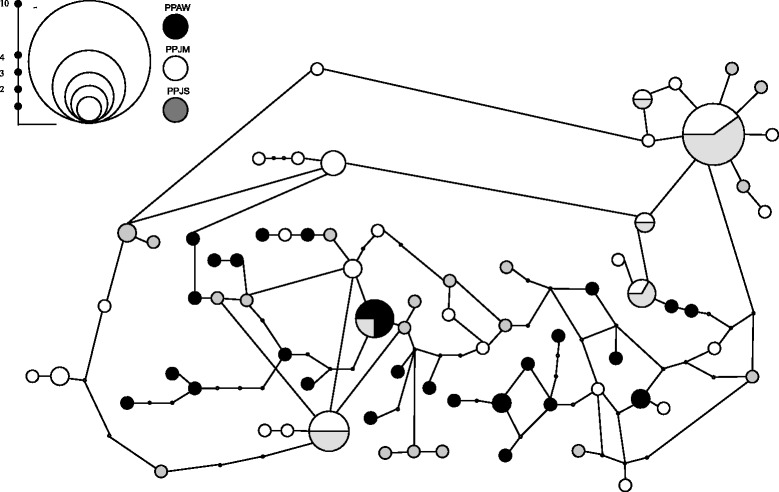
Fig. 3.

Parsimony network produced from DNA sequence data of PpSP15 using TCS 1.21 [73]. Connection limits of 95 % were used between haplotypes and gaps were treated as missing data. Reticulations in the resulting network were broken using the rules of Crandall et al. [74]. Circle diameter is representative of haplotype frequency and color representative of collection location as denoted in the legend and scale bar
