
Figure 4.
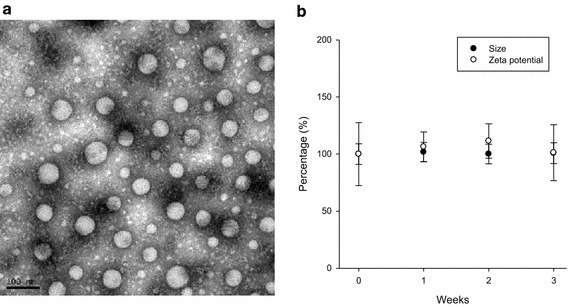
Transmission electron microscopic micrograph of PNiPAAm8-b-PCL20 micelles (a) and storage stability of PNiPAAm8-b-PCL20 micelles determined by average size and zeta potential (b). Each value represents the mean ± SD (n = 4).
Official websites use .gov
A
.gov website belongs to an official
government organization in the United States.
Secure .gov websites use HTTPS
A lock (
) or https:// means you've safely
connected to the .gov website. Share sensitive
information only on official, secure websites.
Transmission electron microscopic micrograph of PNiPAAm8-b-PCL20 micelles (a) and storage stability of PNiPAAm8-b-PCL20 micelles determined by average size and zeta potential (b). Each value represents the mean ± SD (n = 4).