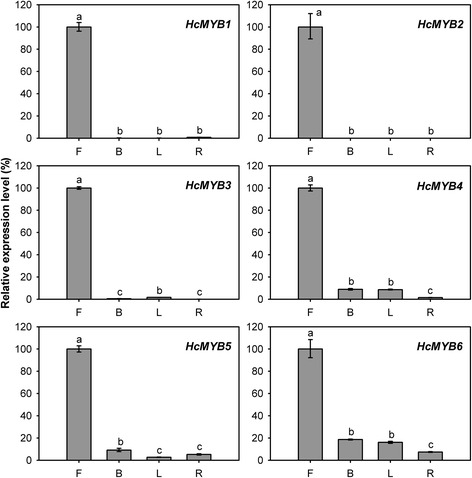
Fig. 12.

Expression analysis of HcMYB1-6 in different tissues. Relative transcription level of flowers was set to 1 (100 %). Error bars indicate the calculated maximum and minimum expression quantity of three replicates. Different lowercase letters labeled on bars indicate statistically significant differences at the level of P < 0.05. F, flowers; B, bracts; L, leaves; R, rhizomes
