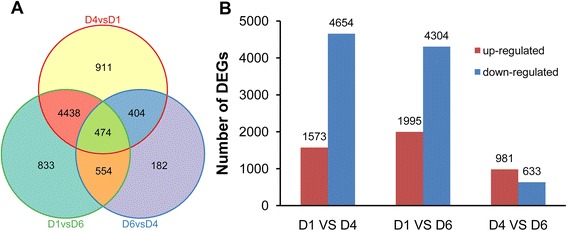
Fig. 3.

Gene expression comparisons. a Venn diagram of number of DEGs. Genes in overlapping sets show the differential expression in two or three comparison pairs. b Changes in gene expression profile. The numbers of up-regulated and down-regulated genes between D1 and D4, D1 and D6, D4 and D6 are summarized
