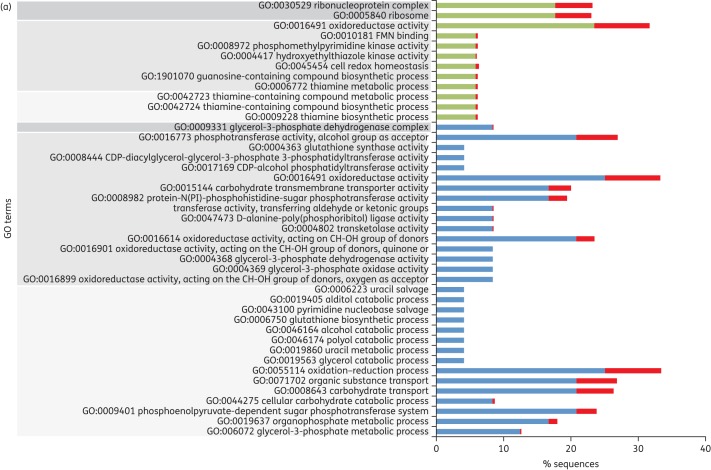
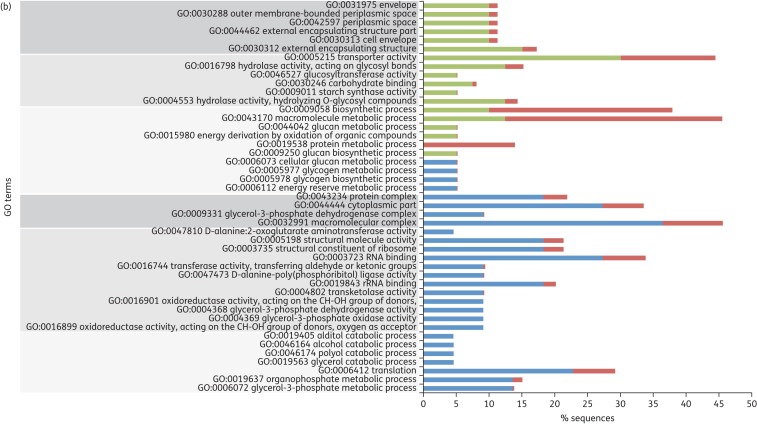
Figure 3.
GO classification of genes whose expression is significantly altered in S. pneumoniae tetracycline-resistant mutants. Genes differentially expressed (P ≤ 0.015) in (a) R6M1TC-5 and (b) R6M2TC-4 compared with S. pneumoniae R6 WT were clustered according to their ontology. GO terms surrounded by dark grey, medium grey and light grey correspond to cellular component-, molecular function- and biological process-associated GO terms, respectively. The percentage of sequences associated with a specific GO term is shown for overexpressed genes (green), down-regulated genes (blue) and overall S. pneumoniae R6 genes (red). This figure appears in colour in the online version of JAC and in black and white in the print version of JAC.


