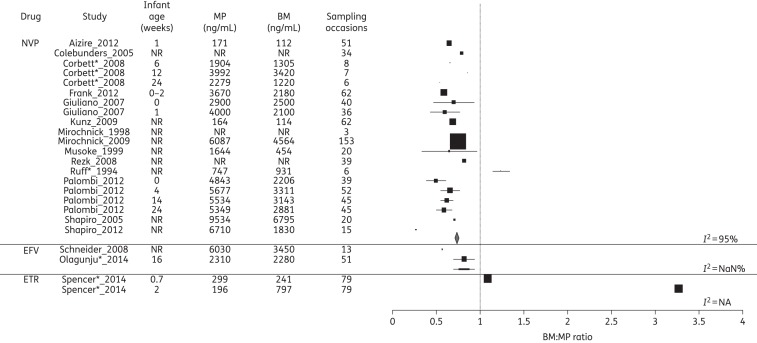
Figure 2.
Forest plot of BM : MP ratios for NNRTIs. Mean (SD) BM : MP ratios are illustrated for each drug. Where studies reported drug levels measured at different infant ages (representing different sampling times post-partum), these are represented as a separate line. The vertical line indicates a BM : MP ratio of 1, where BM and MP levels are equal. Pooled statistics are shown by the diamond and the I2 statistic is indicated. NVP, nevirapine; EFV, efavirenz; ETR, etravirine; NR, not reported; NaN, not a number; NA, not available. *Conference proceeding.

