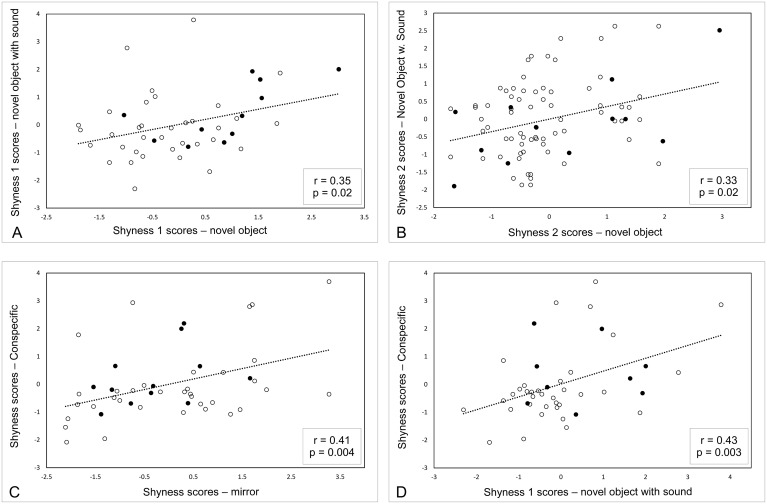
Fig 1. Scatterplots of the four significant correlations of shyness measures across tests.
A) The Shyness 1 scores from the novel object with sound test vs the Shyness 1 scores from the novel object test. B) The Shyness 2 scores from the novel object with sound test vs the Shyness 2 scores from the novel object test. C) The Shyness scores from the conspecific test vs the Shyness scores from the mirror test. D) The Shyness scores from the conspecific test vs the Shyness 1 scores from the novel object with sound test. Filled-in circles represent females and open circles represent males. The dotted lines are linear trend lines (based on linear regression) added using Microsoft Office Excel 2013.

