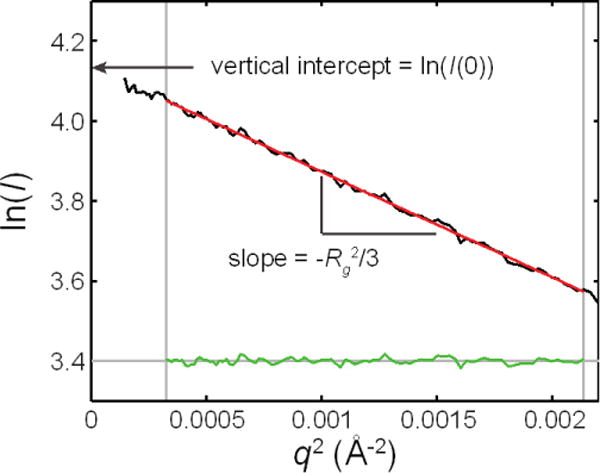
Figure 6. Example of Guinier analysis.

A line (red) is fitted to the low q region of a Guinier curve (black), such that maximum q to be included in the fit is 1.3/Rg or less. The linearity of the fitted region is determined by the flatness of the residuals (green). Rg is derived from the slope, and I(0) is derived from the vertical intercept.
