
Figure 8. The pair distance distribution function, P(r), is sensitive to concentration effects and sample polydispersity.
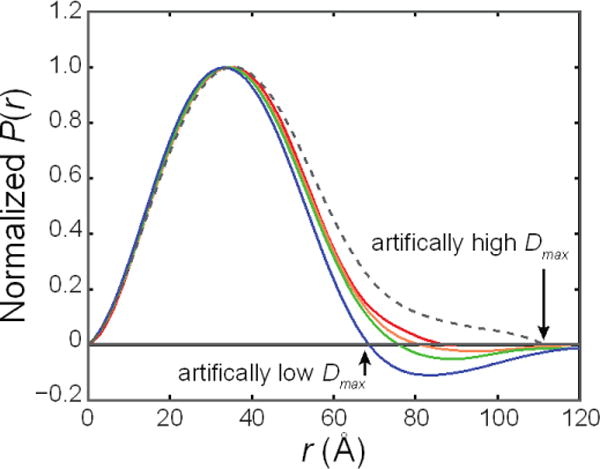
Here, PRIMUS17 was used to automatically generate the P(r) of purified HSA (solid curves, from red to blue: 1.9–15.9 mg/mL) and unpurified HSA at 1.9 mg/mL (dotted curve). Inter-particle repulsion leads to negative regions at high r, which leads to an artificially low Dmax. The presence of aggregates or higher order oligomers extends P(r) at high r, leading to an artificially high Dmax.