

Abstract
Objective
To perform a systematic review to analyze the diagnostic yield of magnetic resonance imaging (MRI) for pediatric hearing loss, including comparison to computed tomography (CT) and subgroup evaluation according to impairment severity and specific diagnostic findings (cochlear anomalies, enlarged vestibular aqueduct, cochlear nerve abnormalities, and brain findings).
Data Sources
Pubmed, EMBASE, and the Cochrane library were assessed from their inception through December 2013. Manual searches were also performed, and topic experts were contacted.
Review Methods
Data from studies describing the use of MRI with or without comparison to CT in the diagnostic evaluation of pediatric patients with hearing loss were evaluated, according to a priori inclusion/exclusion criteria. Two independent evaluators corroborated the extracted data. Heterogeneity was evaluated according to the I2 statistic.
Results
There were 29 studies that evaluated 2434 patients with MRIs and 1451 patients with CTs that met inclusion/exclusion criteria. There was a wide range of diagnostic yield from MRI. Heterogeneity among studies was substantial but improved with subgroup analysis. Meta-analysis of yield differences demonstrated that CT had a greater yield than MRI for enlarged vestibular aqueduct (yield difference 16.7% [95% CI, 9.1%–24.4%]) and a borderline advantage for cochlear anomalies (4.7% [95% CI, 0.1%–9.5%]). Studies were more likely to report brain findings with MRI.
Conclusions
These data may be utilized in concert with that from studies of risks of MRI and risk/yield of CT to inform the choice of diagnostic testing.
Keywords: hearing loss, magnetic resonance imaging, computed tomography, malignancy, temporal bone anomaly, diagnostic yield, infant, child, adolescent, pediatric
Introduction
The prevalence of pediatric hearing loss may be as high as 3% to 20%, with more recent estimates suggesting that it is increasing over time.1–3 The clinical evaluation of hearing loss frequently includes imaging via computed tomography (CT) or magnetic resonance imaging (MRI). While CT has classically been the mainstay of radiological investigation, more recent authors have espoused an increased role for MRI.4,5 The decision regarding which modality to pursue may be complex, and the literature offers little consensus. Some investigators continue to favor CT, which delivers finer discrimination of bony structures,6–9 while others have preferred the higher soft tissue resolution of MRI as a singular modality.4,5 Yet other authors view the 2 modalities as complementary and select an initial study based on the presentation of the patient, including laterality of hearing loss, age, and other associated diagnoses.10 Thus, the ideal approach remains ill defined.
Systematic reviews provide an established, rigorous method to investigate the current best evidence regarding a specific clinical question and are among the highest level of evidence available.11–13 These analyses utilize “explicit methods to systematically search, critically appraise, and synthesize the world literature on a specific issue.”14 While they typically require as much or more effort than the underlying source articles,15–17 the resulting presentation reduces bias, random error, and confounding and is thus more powerful than a traditional narrative review.13,14 We therefore performed a systematic review to evaluate the diagnostic yield of MRI in infants, children, and adolescents with hearing loss. More specifically, our objectives were to determine: (1) the current state of the evidence directly comparing MRI and CT results in this patient population, (2) the prevalence of imaging-identified diagnoses in those undergoing MRI for hearing loss, (3) the specific diagnoses present among those with abnormal findings, and (4) the subgroup-specific diagnostic yield according to hearing severity and laterality. These analyses complement our additionally reported work that evaluates the risks (subsequent malignancy) and benefits (diagnostic yield) specific to CT.18,19
Methods
A search was performed focusing on the diagnostic yield of MRI in infants and children with hearing loss according to an a priori protocol. Computerized and manual searches were performed to identify all relevant data. A PubMed search of MEDLINE from 1966 through December 2013 was performed. Articles that mapped to the exploded medical subject heading magnetic resonance imaging and those that mapped to text words magnetic resonance imaging were collected into a first group. Next, articles mapping to the exploded medical subject headings hearing loss; ear, inner/diagnosis; ear, inner/pathology; ear, inner/radiography; as well as the text word hearing were collected into a second group. Articles that mapped to the exploded medical subject headings child and infant and those that mapped to the text words pediatric and newborn were then collected into a third group. The 3 groups were then cross-referenced and limited to those with human subjects and English language. Case reports, as defined by the PubMed medical subject heading identifier, were excluded. Two independent searches were performed by individuals blinded to the other’s results. In addition, parallel searches with corresponding terms were repeated in EMBASE and the Cochrane Library from their inception through December 2013.
This initial search yielded 775 studies. The abstracts were evaluated according to the specific, predetermined inclusion/exclusion criteria described in the following. Reference lists from criteria-meeting publications and narrative reviews were manually searched for additional studies, and experts in the field were contacted, yielding 14 additional potential articles. Titles and abstracts for all identified studies were reviewed, and ultimately 228 full articles were evaluated (Figures 1A, 1B).
Figure 1.
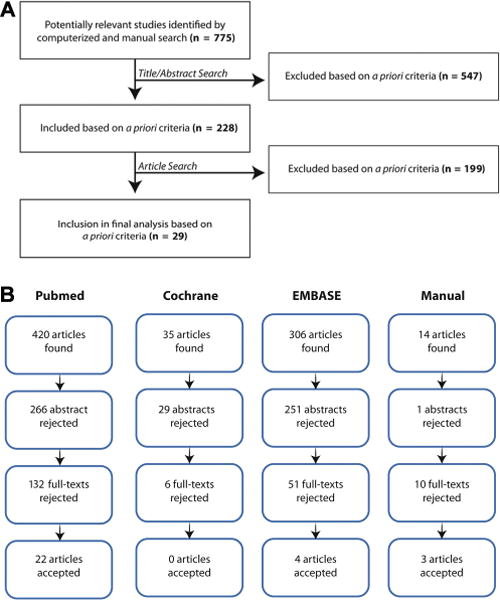
(A) Flow diagram showing the stages of identification of studies. (B) Flow diagram showing the stages of identification of studies by citation source.
Inclusion/Exclusion Criteria
Articles identified by the search strategy described previously were evaluated to identify those that met the following inclusion criteria: (1) patient population under 21 years of age with unilateral, bilateral, conductive, or sensorineural hearing loss; (2) MRI of the temporal bone, brain, or head performed for the purpose of diagnosing or guiding management of hearing loss; (3) outcome measured in terms of the proportion of those undergoing MRI in which the imaging establishes a new diagnosis of a temporal bone or brain anomaly or further delineates the specific types of anomalies identified. Prospective, retrospective, and comparative studies and case series were included. Articles were excluded if: (1) patients were over 21 years of age; (2) hearing results were not definitively delineated; (3) hearing loss was temporary; (4) no MRI of the temporal bone, brain, or head was performed; (5) MRIs were obtained for reasons not associated with hearing loss; (6) the cause for hearing loss in the study population had already been previously fully identified; (7) no quantitative data were presented; (8) isolated case reports; and (9) the study population was restricted to those with specific syndromes. Syndromes may “artificially” raise the diagnostic yield as some have an increased risk of inner ear anomalies.20,21 So as to prevent loss of data from reports of pooled patient groups with a very small subset of syndromic patients who were otherwise relevant, publications of study populations with a <15% syndromic component were allowed inclusion (see Appendix 1 at www.otojournal.org). Auditory neuropathy/auditory dyssynchrony (ANAD) patients were included but evaluated only in a separate subset, since prior publications have suggested that their MRI imaging yield differs from that of other pediatric patients with hearing loss,10 with discrete characteristics apart from other causes of pediatric hearing loss. This process yielded 29 criterion-meeting studies.
Data Extraction
Data extraction additionally focused on potential sources of heterogeneity or bias among reports and study identification (author, publication year, full citation). Extracted data included: (1) number/percentage of patients with MRI and CT scans revealing a new diagnosis of temporal bone or brain anomaly, (2) number/percentage subsets of specific types of anomalies identified by MRI and CT, (3) consecutive or nonconsecutive status of reported patients, and (4) mean follow-up time. Also collated were: (a) age at time of imaging, (b) extent of hearing loss in the study population, (c) types of hearing loss studied, and (d) study design with potential confounders. In accordance with data demonstrating that isolated “study quality” ranking scale summary results may be misleading or give heterogeneous results,22–25 we focused on evaluation of data quality by consistent factual description of individual elements of study design: prospective/retrospective analysis, incorporation of blinding, assessment of interrater reliability, diagnostic criteria, and reporting of imaging protocols. Individual elements were selected from the STARD criteria for diagnostic testing.26 Two reviewers corroborated extracted data independently using standardized tables.
Quantitative Analysis
Diagnostic yield was defined as the proportion of patients affected according to the defined imaging modality: yield = (number of patients with imaging-established diagnoses)/(number of patients imaged by that modality). Nearly all studies reported their findings per patient, but in the minority instance when it was reported per ear, the data were nonetheless included in the systematic review and meta-analysis in the translated per-patient increment, since imaging is ordered for a single patient, rather than a single ear at a time (ie, both ears are imaged even when unilaterally symptomatic). In the single instance where findings were reported per ear and not per patient,27 the data were reported in the systematic review but excluded from the pooled quantitative meta-analysis so as to avoid confounding the measured proportion of patients. In the single instance in which CT findings were reported as a proportion of the MRI findings, rather than the proportion imaged (ie, CT results only among those with abnormal MRI),5 the data were likewise reported in the systematic review but excluded from the comparative pooled meta-analysis.
For counts of cochlear anomalies, the following diagnoses were included: cochlear dysplasia, cochlear hypoplasia, cochlear aplasia, Michel deformity, Mondini malformation, modiolar deficiency, cochlear agenesis, fibrosis of the basilar turn, labyrinthitis ossificans, labyrinthine obliteration, cochlear malformation, and cochlear anomaly. For counts of enlarged vestibular aqueduct, the following diagnoses were included: enlarged vestibular aqueduct, large aqueduct, and in 1 publication “ELD” as a header in tabular data with the description of abnormalities in the endolymphatic duct in the text.5 Cochlear nerve and internal auditory canal abnormalities were tallied separately, given that these may be assessed at distinct anatomic sites. The former included cochlear nerve aplasia, hypoplasia, dysplasia, and deficiency. In addition, in one instance it included a tally of the “cochter” nerve [sic] in tabular format, with the cochlear nerve referenced in the text of the manuscript.5 The latter included internal auditory canal hypoplasia, dysplasia, deficiency, and in 1 subject duplication.28 Brain findings were sorted as described in the footnote to the table in Appendix 3B (available at www.otojournal.org). For counts of all diagnoses, any reported diagnosis made by the imaging modality indicated was counted, also at the patient level. Thus, every effort was made to (1) ideally utilize a composite total number of affected patients from the primary report and (2) account for the potential for overlapping diagnoses in a single patient when (1) was not provided. For this latter reason, if a sum total number of patients affected was reported such that it was unclear whether the findings did or did not overlap within the same patients, the individual numbers were not simply summed to establish a total; in one instance it was not reported whether cochlear/aqueduct findings and internal auditory canal findings occurred in separate or overlapping patients.29
Differences in diagnostic yield were calculated as the difference between the diagnostic yield of CT and the diagnostic yield of MRI, such that a positive difference reflected a comparison suggesting a higher yield for CT, while a negative difference was indicative of greater yield from MRI. Differences were chosen, rather than relative ratios, so as to quantify comparisons in absolute rather than relative terms.
Heterogeneity among studies was evaluated using the I2 statistic, which is a measure of the variation between studies that exceeds that from chance alone. Perfectly homogeneous studies have a theoretical I2 value of 0%. The range from 0% to 40% is thought to represent unimportant heterogeneity, while the overlapping values of 30% to 60% and 50% to 90% have been postulated to represent moderate and substantial heterogeneity, respectively.30,31 Ninety-five percent confidence or “uncertainty” intervals were calculated according to standard techniques,32 since the number of studies in subgroup analyses was small. Data were further formally evaluated and presented in meta-analysis (ie, forest plot with random effects pooled estimate) if the point estimate for I2 was <60% and the 95% confidence interval overlapped 0% to 40%. If these criteria were not met, the pooled result is reported in tabular format but should be interpreted with caution due to measured heterogeneity, as increased heterogeneity makes a pooled result less likely to be reliable.
Meta-analyses were performed using a random effects approach, according to the standard technique of DerSimonian and Laird, to obtain a weighted pooled risk difference or pooled proportion.33,34 Assessment of publication bias was performed with Egger’s test and funnel plot.35 Statistical analyses and calculations were performed in Stata 12.0 (College Station, Texas), Medcalc (Ostend, Belgium), and Microsoft Excel (Redmond, Washington).
Results
There were 29 studies (n = 2434 patients with MRI, n = 1451 patients with CT) that met inclusion and exclusion criteria.5,7,8,27,28,36–56 The vast majority were retrospective case series with chart review, although 3 utilized a prospective study design.36,55 The data from these publications are presented in the following in the following sequence: (1) studies of children without ANAD who underwent both CT and MRI (ie, directly comparative data), (2) studies of children without ANAD who underwent MRI, and (3) studies of children with ANAD.
Studies of Children with Hearing Loss Who Underwent Both CT and MRI
Both CT and MRI were obtained in overlapping children with hearing loss in 14 studies (n = 1451 patients with CT, n = 836 patients with MRI; no ANAD). Six of these focused exclusively on children with severe to profound hearing loss (Table 1), while 8 included children with a range of hearing impairment (Table 2). The preponderance of data arose from retrospective case series of consecutive patients. Twelve of the 14 studies included imaging-specific descriptions of all patients who had CT with all patients who had MRI. One study reported results of CT and MRI combined in 1 diagnostic group. Another study reported CT results only among those with abnormal MRI but did not report the converse; thus, the denominator for diagnostic yield for CT scan overall was not comparable to those of other groups. Both of these reports were thus presented but excluded from quantitative pooled comparative analyses. Overall, the 14 studies reported variably on the discrete numbers of all combined anomalies, cochlear anomalies, enlarged vestibular aqueduct, and abnormalities of the cochlear nerve and internal auditory canal, as delineated in Tables 1 and 2. There was no evidence of publication bias (P = .955, Appendix 2, available at www.otojournal.org).
Table 1.
Studies Reporting Both CT and MRI Findings in Children with Severe to Profound Hearing Loss.
| Lin, 201183
|
Trimble, 200757
|
Kong, 200929
|
Declau, 200836
|
Komatsubara, 200737
|
Parry, 20055
|
|||||||
|---|---|---|---|---|---|---|---|---|---|---|---|---|
| Imaging Findings | CT | MR | CT | MR | CT | MR | CT | MR | CT | MR | CTa | MR |
| All anomalies | 18% (43/245) | 40% (98/242)b | 59% (54/92) | 32% (29/92) | — | — | 27% (9/33) | 21% (5/23) | — | — | 87% (21/24)a | 63% (35/56) |
| Cochlear anomalies/dysplasia/hypoplasia/modialar deficiency/ossification | 10% (25/245) | 21% (19/92) | 23% (21/92) | 16% (11/68)c | 28% (19/68)c | — | — | — | — | 33% (8/24)a | 41% (23/56) | |
| Enlarged vestibular aqueduct | 5% (13/245) | — | 28% (26/92) | 2% (2/92) | c | c | — | — | — | — | 42% (10/24)a | 18% (10/56) |
| Cochlear nerve aplasia/hypoplasia/dysplasia/deficiency | (15/26 had correlated CT IAC findings) | 11% (26/242) | 9% (8/92) | 2% (2/92) | — | — | — | — | 67% (10/15) | 60% (9/15) | — | 16% (9/56) |
| IAC hypoplasia/dysplasia/deficiency | 7% (18/245) | (15/18 had correlated MRI cochlear nerve findings) | — | — | 3% (2/68) | 4% (3/68) | — | — | — | — | — | — |
| Brain anomalies | — | 24% (57/242) | 7% (6/92) | 37% (34/92) | — | — | — | — | — | — | — | 30% (17/56) |
| Reported diagnostic distinctions | CT and MRI typically concordant. Nonconcordance only in 3 EVAs seen on CT but not MR, and 3 narrow lACs with normal MRI cochlear nerves. |
CT was more likely to identify EVA than MRI. CT missed early obliterative labyrinthitis and cochlear nerve/IAC anomalies when compared to MR |
In 1 patient, CT showed bilateral IAC widening, while MRI showed barely recognizable auditory nerves. The patient ultimately benefited from cochlear implant. | “CT scan had a slightly higher rate of abnormality detection.” | Among patients with a CNC of < 1.5 mm width on CT, MRI diagnosed cochlear nerve deficiency in 88.9% of cases. | “MRI is more sensitive and specific in diagnosing soft tissue abnormalities in the inner ear than CT in cochlear implant candidates.” | ||||||
Abbreviations: CNC, cochlear nerve canal; CT, computed tomography; EVA, enlarged vestibular aqueduct; IAC, internal auditory canal; MRI, magnetic resonance imaging.
CT results were only reported among n = 24 patients with abnormal MRI results.
24% (57/242) of the reported anomalies were categorized by the authors as directly related to hearing loss.
Study reported cochlear anomalies and EVA combined.
Table 2.
Studies Reporting Both CT and MRI Findings in Children with Unspecified, Uncategorized, or a Range of Types of Hearing Loss.
| Miyasaka, 201028
|
Simons, 20068
|
Preciado, 20047
|
Mafong, 200238,a
|
Ohlms, 199939
|
Tarshish, 201340
|
Ghogomu, 201341,b
|
Haffey, 201342
|
|||||||||
|---|---|---|---|---|---|---|---|---|---|---|---|---|---|---|---|---|
| Imaging Findings | CT | MR | CT | MR | CT | MR | CT | MR | CT | MR | CT | MR | CT | MR | CT | MR |
| All anomalies | 29% (6/21) | 33% (7/21) | 41% (50/123) | 30% (15/50) | 29% (149/511) | 13% (20/155) | 37% (33/90) | 33% (7/21) | 25% (14/56) | — | 13% (2/14) | 23% (3/13) | 31% (30/98) | 26% (11/43) | 32% (20/61) | 32% (10/31) |
| Cochlear anomalies/dysplasia/hypoplasia/modialar deficiency/ossification | 14% (3/21) | — | 12% (15/123) | 6% (3/50) | — | — | 12% (11/90) | — | 5% (3/56) | — | — | — | 8% (8/98) | 5% (2/43) | 13% (8/61) | 3% (1/31) |
| Enlarged vestibular aqueduct | 10% (2/21) | — | 28% (35/123) | 12% (6/50) | c | c | 14% (13/90) | — | 2% (1/56) | — | 7% (1/14) | 8% (1/13) | 16% (16/98) | 5% (2/43) | 25% (15/61) | 3% (1/31) |
| Cochlear nerve aplasia/hypoplasia/dysplasia/deficiency | 20% (4/21) | 33% (7/21) | — | 6% (3/50) | c | c | — | — | — | — | — | — | — | (1/43) | — | — |
| IAC hypoplasia/dysplasia/deficiency/duplication | 5% (1/21) | — | 2% (3/123) | — | — | — | 1% (1/90) | — | 2% (1/56) | — | — | — | 5% (5/98) | — | — | 10% (1/10) |
| Brain anomalies | — | — | 3% (4/123) | 10% (5/50) | — | — | — | 19% (4/21) | 0% (0/8) | 0% (0/6) | — | 8% (1/13) | — | — | — | 40% (4/10)_ |
| Reported diagnostic distinctions | 8 ears concordant CT CNS and MRI CNHA; 2 nonconcordant | 69% (29/42) concordant; 13 nonconcordant (9 CT+/MRI−; 4 MRI+/CT−) |
CT higher yield than MRI (P < .0005). Unilateral HL higher yield than bilateral (P = .0040). | Of the 7 abnormal MRIs, 4 had findings distinct from CT, primary brain abnormalities. | Neither CT nor MRI of the brain uncovered the etiology of hearing loss. | 8 concordant; 3 nonconcordant |
Among 6 who had CT and MRI and positive findings, half were nonconcordant on report but present on re-review of images. | When CT+, MRI+ in only 50% of cases, but MRI found anomalies not detected on CT in 11%. | ||||||||
Abbreviations: CNHA, cochlear nerve hypoplasia/aplasia; CNS, cochlear nerve stenosis; CT, computed tomography; HL, hearing loss; MRI, magnetic resonance imaging.
Only MRI findings distinct from CT findings were reported.
Patients with multiple abnormalities were grouped together, without distinguishing individual findings in that subset.
Does not distinguish whether individual imaging findings were identified via CT or MRI.
Among these comparative studies, there was a notable amount of heterogeneity (measured variation from more than chance alone) as measured by I2 (Table 3), particularly when studies of all imaging findings and all ranges of hearing loss were considered together. Even when the subgroup of studies evaluating only children with severe to profound impairment were considered separately, there was still substantial heterogeneity among studies. Interestingly, there was less heterogeneity when the subgroup of studies including children with the full range (mild to profound) of hearing loss was included. Less surprisingly, there was decreased heterogeneity when specific diagnostic categories (cochlear anomalies, enlarged vestibular aqueduct, and abnormal cochlear nerves) were considered separately. Even among subgroups with a lower point estimate of I2, however, there was a large associated 95% confidence interval.
Table 3.
Heterogeneity and Aggregate Results among Studies of Children with Hearing Loss, Difference in Proportion with Diagnostic Yield.a
| Studies Included | Imaging Modality | Imaging Findings Included | Number of Studies in Comparative Group | I2 (95% CI) | Yield Difference (95% CI)b |
|---|---|---|---|---|---|
| All studies | CT vs MRI | All imaging findings | 10 | 88% (79%–92%) | 3% (–9% to 17%) |
| Studies of children with severe-profound hearing loss | CT vs MRI | All imaging findings | 3 | 95% (88%–98%) | 3% (–32% to 38%) |
| Studies of children with the full range of hearing loss | CT vs MRI | All imaging findings | 7 | 21% (0%–64%) | 8.7% (1.8%–15.6%) |
| All studies | CT vs MRI | Cochlear anomalies | 4 | 0% (0%–86%) | 4.7% (0.1%–9.5%) |
| All studies | CT vs MRI | Enlarged vestibular aqueduct | 5 | 51% (0%–82%) | 16.7% (9.1%–24.4) |
| All studies | CT vs MRI | Cochlear nerve canal abnormality | 3 | 28% (0%–98%) | 2.8% (–9.8% to 15.3%) |
| All studies | CT vs MRI | Internal auditory canal abnormality | 1 | — | — |
| All studies | CT vs MRI | Brain anomalies | 2 | 90% (72%–96%) | –13% (–32% to 7%) |
Abbreviations: CT, computed tomography; MRI, magnetic resonance imaging.
No data from studies of patients with auditory neuropathy are included here (see appendix).
Pooled diagnostic yields in the setting of substantial heterogeneity (ie, I2 > 60%) should be interpreted with caution. Negative yield differences reflect that the comparison favors MRI. Positive yield differences reflect that the comparison favors CT.
According to a priori criteria, data were formally presented in a meta-analysis (ie, forest plot with random effects pooled estimate) if the calculated I2 was <60% and its 95% confidence interval overlapped 0% to 40%; these criteria were met in 4 subgroups. The first criteria-meeting subgroup included all imaging findings in patients with the range of hearing impairment (Figure 2). The pooled difference in diagnostic yield was 8.7% (1.8%–15.6%), with a higher yield from CT than MRI in the reported studies.
Figure 2.
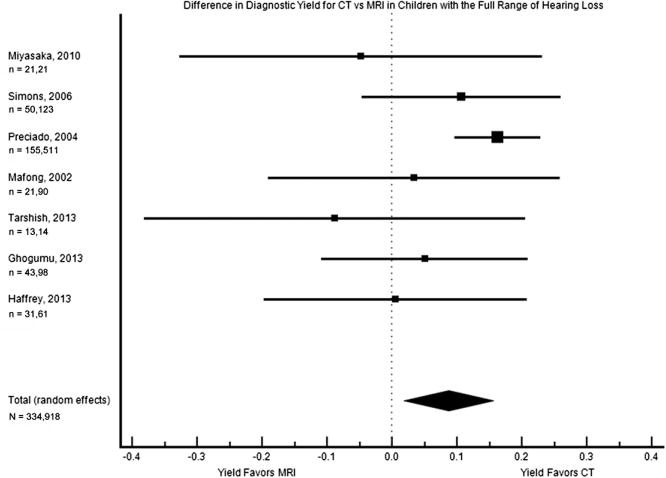
Forest plot of the difference in diagnostic yield for children with the full range of hearing loss (mild to profound). The square sizes reflect the weight assigned to each study. For each study, the sample sizes are denoted: n = (number who had MRI), (number who had CT). For the pooled data, the total sample size is denoted: N = (total number who had MRI), (total number who had CT). MRI, magnetic resonance imaging; CT, computed tomography.
Cochlear anomalies were reported on CT scan but not MRI in 4 of these studies, while no studies reported these on MRI alone. Four studies evaluated both CT and MRI in parallel in the same study population, and they were the second subgroup to meet criteria for meta-analysis (Figure 3). The pooled difference in diagnostic yield was 4.7% (0.1%–9.5%), with a borderline higher yield from CT than MRI.
Figure 3.
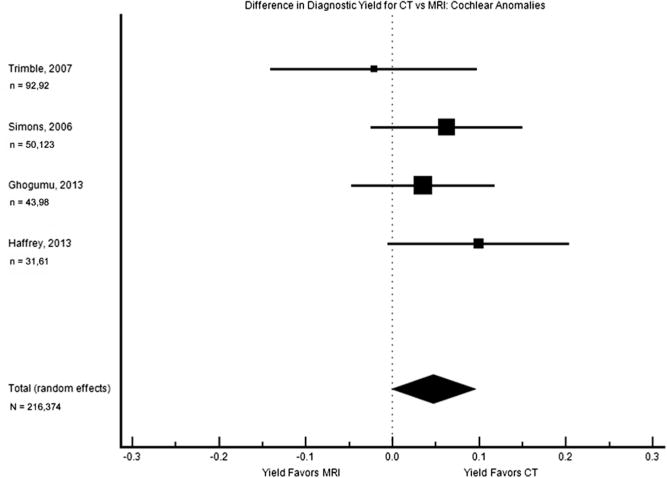
Forest plot of the difference in diagnostic yield for cochlear anomalies. The square sizes reflect the weight assigned to each study. For each study, the sample sizes are denoted: n = (number who had MRI), (number who had CT). For the pooled data, the total sample size is denoted: N = (total number who had MRI), (total number who had CT). MRI, magnetic resonance imaging; CT, computed tomography.
Enlarged vestibular aqueduct was described in CT scan but not MRI in 4 of these studies, while no studies described these on MRI alone. Five studies analyzed both CT and MRI results in the same patient population, and this subgroup was the third with heterogeneity low enough to support pooling of data (Figure 4). On meta-analysis, the pooled difference in diagnostic yield was 16.7% (9.1%–24.4%), with a notably higher yield from CT than MRI.
Figure 4.
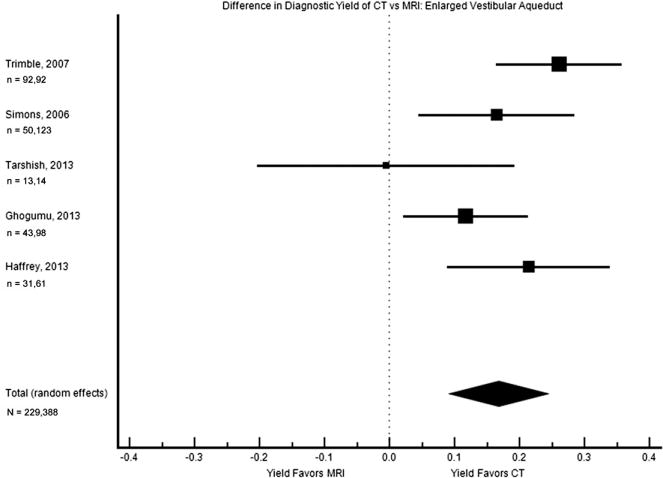
Forest plot of the difference in diagnostic yield for enlarged vestibular aqueduct. The square sizes reflect the weight assigned to each study. For each study, the sample sizes are denoted: n = (number who had MRI), (number who had CT). For the pooled data, the total sample size is denoted: N = (total number who had MRI), (total number who had CT). MRI, magnetic resonance imaging; CT, computed tomography.
The status of the cochlear nerve was described only via MRI in 4 of these studies with comparative data. The 3 studies that provided data on CT and MRI diagnosis of cochlear nerve anomalies met criteria for meta-analysis, but there was a nonsignificant result with a broad confidence interval (difference in diagnostic yield 2.8% [–9.8% to 15.3%], Figure 5). Internal auditory canal findings were not directly compared from CT to MRI in the full study population, except in 1 publication,57 where the yield was noted to be comparable (Table 1).
Figure 5.
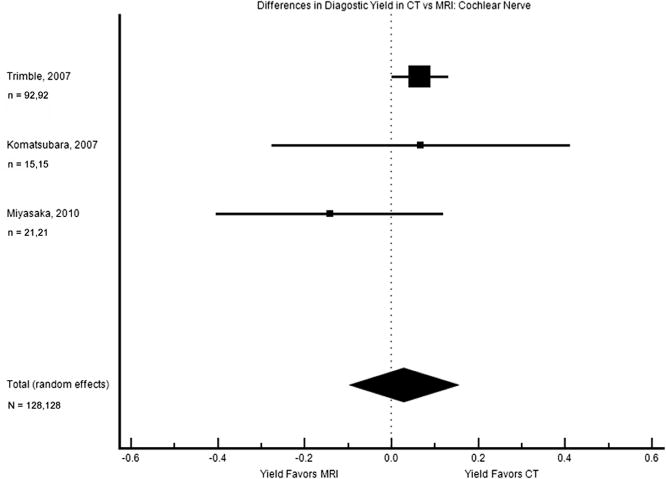
Forest plot of the difference in diagnostic yield for cochlear nerve abnormalities. The square sizes reflect the weight assigned to each study. For each study, the sample sizes are denoted: n = (number who had MRI), (number who had CT). For the pooled data, the total sample size is denoted: N = (total number who had MRI), (total number who had CT). MRI, magnetic resonance imaging; CT, computed tomography.
Brain findings were reported solely through MRI in 5 of these comparative studies. There were 3 studies that compared brain-related diagnoses in CT and MRI; these had substantial heterogeneity and their data were thus not pooled. The bulk of these data suggested a diagnostic yield for brain that favored MRI, with a yield as much as 30.4% greater in 1 study,57 but these subgroups did not meet criteria for formal pooling/forest plot presentation.
Concordant and nonconcordant findings between CT and MRI were reported variably among studies (Tables 1,2). Among those that did report enough complete CT and MRI individual-level numerical data to determine the related percentages, there was a 20% to 57% probability of nonconcordant findings, although these data are notably limited.
Studies of Children with Hearing Loss Who Underwent MRI
Twenty-five studies (n = 2116) reported on the diagnostic yield of MRI in children with hearing loss (temporal bone and brain findings, no ANAD). Twenty-two studies (n = 1941 patients, no ANAD) reported the diagnostic yield of MRI for otological anomalies. There was a substantial amount of heterogeneity among studies, regardless of whether results were reported as otological and brain findings, otological findings alone, cochlear nerve findings alone, and brain findings alone (I2 ≥ 71%, Table 4).
Table 4.
Heterogeneity and Aggregate Results among Studies of Children with Hearing Loss, Proportion with Diagnostic Yield.a
| Studies Included | Imaging Modality | Imaging Findings Included | Number of Studies I2 in Group/Subgroup | (95% confidence interval) |
Pooled Diagnostic Yield (95% CI)b |
|---|---|---|---|---|---|
| All studies | MRI | All imaging findings | 21c | 96% (95%–97%) |
26% (17%–37%) |
| All studies | MRI | Both otological and brain findings quantified in non-overlapping patients | 10 | 81% (63%–89%) |
25% (16%–34%) |
| All studies | MRI | Otological findings | 15 | 93% (91%–95%) |
21% (12%–31%) |
| All studies | MRI | Cochlear nerve/internal auditory canal only | 4 | 94% (87%–97%) |
19% (3%–42%) |
| All studies | MRI | Brain findings | 15 | 71% (50%–83%) |
21% (16%–26%) |
| Studies of children with severe-profound hearing loss | MRI | Both otological and brain findings quantified in non-overlapping patients | 3 | 79% (32%–93%) |
28% (14%–4%) |
| Studies of children with severe-profound hearing loss | MRI | Otological findings | 6 | 96% (93%–97%) |
19% (6%–37%) |
| Studies of children with severe-profound hearing loss | MRI | Cochlear nerve/internal auditory canal only | 3 | 94% (86%–97%) |
14% (1%–38%) |
| Studies of children with severe-profound hearing loss | MRI | Brain findings | 7 | 74% (45%–88%) |
24% (17%–31%) |
| Studies of children with unspecified or a full range of hearing loss | MRI | Both otological and brain findings quantified in non-overlapping patients | 7 | 63% (16%–84%) |
23% (15%–33%) |
| Studies of children with unspecified or a full range of hearing loss | MRI | Otological findings | 9 | 85% (73%–91%) |
24% (15%–34%) |
| Studies of children with unspecified or a full range of hearing loss | MRI | Brain findings | 8 | 61% (17%–82%) |
17% (10%–24%) |
| All studies with consecutive patient status specified | MRI | Both otological and brain findings quantified in non-overlapping patients | 10 | 81% (65%–89%) |
25% (16%–34%) |
| All studies with consecutive patient status specified | MRI | Otological findings | 14 | 94% (92%–96%) |
21% (12%–32%) |
| All studies with consecutive patient status specified | MRI | Brain findings | 13 | 70% (47%–83%) |
20% (15%–25%) |
Abbreviations: CT, computed tomography; MRI, magnetic resonance imaging.
All imaging findings includes both studies with the range of imaging findings and studies of single anomalies.
As described in the methods, the single study27 that described results according to the denominator of ears instead of patients was not included on the composite analysis, so as to avoid confounding the measured proportion of patients. There was a single instance where it was not reported whether cochlear/aqueduct findings and internal auditory canal findings occurred in overlapping patients; so as to prevent imputing inaccurate patient counts, it was also excluded from the pooled analyses.29 No data from studies of patients with auditory neuropathy are included here (see appendix).
Pooled diagnostic yields in the setting of substantial heterogeneity (ie, I2 > 60%) should be interpreted with caution.
Nine of these specifically evaluated children with severe to profound hearing loss, most of which were undergoing evaluation for cochlear implantation (Table 5). Eight reported on consecutive patients, while the consecutive status was not reported in 1 article. There was 1 prospective study and 8 retrospective cases series with chart review. Diagnostic yields ranged from 2% to 60%, with a variety of study objectives. Among the imaging findings uncovered by MRI, there was a wide distribution of diagnoses (Table 6), and heterogeneity among this subgroup of studies remained substantial (Table 4).
Table 5.
Studies of MRI in Children with Severe to Profound Hearing Loss of Unknown Etiology.
| Author, Year | Study Design | Percentage (proportion) with MRI-Identified Diagnoses | Age Group | Extent of Hearing Loss in the Study Population | Additional Comments |
|---|---|---|---|---|---|
| Trimble, 200757 | Prospective case series with chart review of CI candidates | 32% (29/92) of patients (otological, non-brain anomalies) | 7 months–17 years (mean: 4.7 years) | Profound HL | Consecutive |
| Young, 201243 | Retrospective case series with chart review of patients with CI | 2% (10/478) of patients (CN deficiency) | 1.1–5.2 years old at implantation (age in overall cohort described as “children”) | Severe/profound bilateral SNHL | Consecutive. CN deficiency was the sole anomaly evaluated. |
| Lin, 201183 | Retrospective case series with chart review of children with severe to profound SNHL | 40% (98/242) of patients (otological and brain) (24% (57/242) with author-identified relation to HL) | “Children” Specific ages NR | Severe to profound SNHL | Consecutive |
| Fahy, 200144 | Retrospective case series with chart review of patients with CI | 4% (7/170) of patients (EVA) | “Children” Specific ages NR | Severe/profound bilateral SNHL | Consecutive |
| Kong, 200929 | Retrospective case series of CI candidates | 28% (19/68) of patients (cochlear anomalies and EVA) 4% (3/68) of patients (IAC anomalies)a | 1–15 years old (mean: 5.4 years) | Profound SNHL | Consecutive. Follow-up time greater than 6 months. Unclear if cochlear/aqueduct and IAC anomalies overlapped in the same patients |
| Parry, 20055 | Retrospective case series with chart review of CI candidates | 63% (35/56) of patients (otological) | NR “pediatric” | Severe/profound bilateral SNHL | Consecutive |
| Russo, 200645 | Retrospective case series with chart review of children with profound SNHL | 18% (3/17) of patients (otological; all brains were normal) | Median age 3 (range <1–14 years old) | Profound hearing loss | Consecutive. Subgroup analysis of profound SNHL of unknown etiology. (CMV, meningitis, rubella, syphilis excluded). Sagittal high-resolution temporal bone MRI. |
| Lapointe, 200546 | Retrospective case series with chart review of patients undergoing evaluation for CI | 20% (8/40) of patients (brain anomalies; 63% [5/8] IAC anomalies in those with brain findings; 0% [0/8] inner ear anomalies in those with brain findings) | “Children” Ages NR | Profound bilateral SNHL | Consecutive |
| Komatsubara, 200737 | Retrospective case series of patients with congenital HL | 60% (9/15) of patients (CN dysplasia) | 6 months–13 years old (mean 5.4 years) | Severe SNHL | Consecutive status NR. CN deficiency was the sole anomaly evaluated. |
Abbreviations: CI, cochlear implant; CMV, cytomegalovirus; CN, cochlear nerve; EVA, enlarged vestibular aqueduct; IAC, internal auditory canal; MRI, magnetic resonance imaging; NR, not reported; SNHL, sensorineuronal hearing loss.
Only inner ear/IAC anomalies reported; overlapping inner ear/IAC patient findings not described.
Table 6.
Counts and Types of Otological Anomalies Identified by MRI in Children with Severe to Profound Hearing Loss.a
| Imaging Findings | Lin, 201183 | Kong, 200929 | Parry, 20055 | Trimble, 200757 | Russo, 200645 | Lapointe, 200546 |
|---|---|---|---|---|---|---|
| Inner ear anomalies (combined) | 42% (41/98) | 28% (19/68)b | — | — | — | — |
| Cochlear anomalies (combined) | — | — | 36% (20/56) | — | — | — |
| Cochlear dysplasia | — | — | 18% (10/56) | 45% (13/29) | — | — |
| Modiolar deficiency or abnormality | — | — | 32% (18/56) | 3% (1/29) | — | — |
| Enlarged vestibular aqueduct | — | — | — | 7% (2/29) | — | — |
| “Vestibular abnormality” | — | — | 29% (16/56) | — | — | — |
| “Endolymphatic duct abnormality” | — | — | 18% (10/56) | — | — | — |
| “Endolymphatic sac abnormality” | — | — | 18% (10/56) | — | — | — |
| Cochlear/IAC anomalies (combined) | — | 4% (3/68) | — | — | — | 63% (5/8) |
| Cochlear nerve aplasia/absence | 16% (16/98) | — | 4% (2/56) | — | — | 13% (1/8) |
| Cochlear nerve hypoplasia | 10% (10/98) | — | 2% (1/56) | — | 67% (2/3) | 39% (3/8) |
| Cochlear nerve “deficiency” | — | — | 11% (6/56) | — | — | — |
| Vestibular nerve hypoplasia | — | — | — | 3% (1/29) | — | — |
| IAC hypoplasia | — | — | — | — | — | 13% (1/8) |
| Combined cochlear and IAC hypoplasia | — | — | — | — | 33% (1/3) | — |
| Small bony island of LSCC/abnormal SCC | — | — | 14% (8/56) | 14% (4/29) | — | — |
| Labyrinthine ossification | — | b | — | 17% (5/29) | — | — |
| CMV-related findings | 16% (16/98) | — | — | — | — | — |
Abbreviations: CMV, cytomegalovirus; CN, cochlear nerve; EVA, enlarged vestibular aqueduct; IAC, internal auditory canal; LSCC, lateral semicircular canal; SCC, semicircular canal.
The denominators shown are the number of patients with non-normal MRI findings. Studies in which CN deficiency or EVA were the sole anomaly evaluated were excluded, since the denominator did not reflect the number of possible anomalies, leading to a default percentage of 100% (Young 2012; Komatsubara 2007; Fahy 2001).
Includes fibrosis of the basal cochlear turn.
Thirteen studies described children with the entire range of hearing loss (mild to profound) or unspecified hearing loss (Table 7). Six studies focused specifically on unilateral/asymmetric hearing loss8,41,42,47,49,56 while 1 study focused entirely on patients with sudden sensorineural hearing loss.40 All studies reported on consecutive patients. There was 1 inception cohort, while the remainder were retrospective cases series with chart review. Diagnostic yields ranged from 0% to 50% with a variety of study objectives. Among the imaging findings in these children with the full range of severity in their hearing loss, there was likewise a wide distribution in diagnoses (Table 8). There was also still notable heterogeneity among this subgroup, although these were the subsets with the lowest heterogeneity overall (I2 ≥ 61%–85%, Table 4)
Table 7.
MRI of Children with Unspecified, Uncategorized, or a Range of Types of Hearing Loss.
| Author, Year | Study Design | Percentage (proportion) with MRI-Identified Diagnoses | Age Group | Extent of Hearing Loss in the Study Population | Additional Comments |
|---|---|---|---|---|---|
| Ghogomu, 201341 | Inception cohort | 26% (11/43) of patients (otological) | Mean 3.5 years old | Profound, 51% (68/134) Severe, 16% (22/134) Moderate, 25% (34/134) Mild, 7% (10/134) |
Consecutive |
| McClay, 200827 | Retrospective case series with chart review of children with unilateral or bilateral SNHL | 40% (108/271) of ears 170 patients | Mean age 5.3 years (1 month–17 years) | Bilateral SNHL, 59% (101/170) Unilateral SNHL, 41% (69/170) Among ears, types of SNHL: Mild, 11% (29/271) Moderate, 19% (51/271) Severe, 10% (28/271) Profound, 41% (110/271) Progressive, 3% (8/271) Sloping, 1% (4/271) Sudden, 1% (3/271) Fluctuating, 1% (4/271) High-frequency, 1% (4/271) Unknown, 11% (30/271) |
Consecutive |
| Preciado, 20047 | Retrospective case series with chart review of children with SNHL | 13% (20/155) of patients (50 had CT and MRI) | 1 week–18 years (mean of 5.8 years, SD 4.9 years for the entire study) | Bilateral severe to profound, 38.8% (60/155) Bilateral moderately severe, 10.9% (17/155) Bilateral mild to moderate, 34.2% (53/155) Unilateral SNHL, 16.1% (25/155) |
Consecutive CT and MRI individual diagnoses results not separated. |
| Clemmens, 201347 | Retrospective case series of patients with unilateral SNHL | 50% (64/128) of patients (otological; brain not reported) | Age at diagnosis: 3 weeks to 16 years (median 5.6 years) | Severe to profound HL, 39% (50/128) | Consecutive Median follow-up was 3.1 years (range, 0–13 years) |
| Simons, 20068 | Retrospective case series with chart review of children with unilateral or bilateral asymmetric HL | 30% (15/50) of patients (otological and brain) | 0–17 years | Unilateral SNHL, 80% (40/50) Asymmetric SNHL, 20% (10/50) |
Consecutive |
| Kimani, 201048 | Retrospective case series with chart review of children with SNHL | 19% (18/97) of patients (inner ear/cochlear abnormalities) | 1–5 years | Profound hearing loss, 46% (43/101) Severe hearing loss, 15% (15/101) Bilateral hearing loss, 85% (87/101) |
Consecutive status of patients NR. All children were referred based on results of newborn hearing screening. |
| Declau, 200836 | Prospective case series with chart review of patients with SNHL | 21% (5/23) of patients (anomaly site/type not specified) | 36–86 days (median 50 days) | Bilateral hearing loss, 59% (68/116) Unilateral hearing loss, 41% (48/116) Median hearing threshold was severe hearing loss. |
Consecutive |
| Haffey, 201342 | Retrospective case series of patients with unilateral SNHL | 32% (10/31) of patients (otological and brain) | 0–17 years old (mean: 5.6 years) | Type of hearing loss: Low frequency, 1% (1/79) Mid-frequency, 22% (17/79) High frequency, 37% (29/79) Flat, 41% (32/79) |
Consecutive Follow-up time of 5 years. |
| Miyasaka, 201028 | Retrospective case series with chart review of children with SNHL | 33% (7/21) of patients (otological) 19% (8/42) of ears (otological) | 1–13 years (mean 7 years) | Unilateral SNHL, 52% (11/21) Bilateral SNHL, 48 (10/21) |
Consecutive |
| Mafong, 200238 | Retrospective case series with chart review of children with SNHL | 33% (7/21) of patients (otological and brain; 4/7 are brain) | 1–18 years (mean 9 years) | Bilateral SNHL, 83% (95/114) of total patients in study (including those without scan data) Unilateral SNHL, 11% (13/114) Moderate to profound hearing loss, 81% (92/114) Mild hearing loss, 19% (22/114) |
Consecutive |
| Tarshish, 201340 | Retrospective case series with chart review of patients with sudden SNHL | 23% (3/13) of patientsa (otological, brain, sinus) | 0.25–18 years at onset of sudden SNHL | Mild/moderate, 15% (2/13) Moderate to severe, 15% (2/13) Severe or sloping to severe, 61% (8/13) Profound or sloping to profound, 8% (1/13) |
Consecutive |
| Brookhouser, 199149 | Retrospective case series with chart review of patientswith unilateral SNHL | 0% (0/7) of patients | 0–19.8 years (mean 8.8 years) | Borderline 19% (12/64) Mild 31% (20/64) Moderate 25% (16/64) Severe 42% (27/64) Profound 19% (12/64) Anacusic 26% (17/64) High-frequency 3% (2/64) |
Consecutive Follow-up data available for periods of 1–15 years. |
| Whittemore, 201284 | Retrospective case series with chart review of patients with persistent conductive HL after tube placement | 0% (0/4) of patients | Age at tympanostomy tube placement: 9 months–16 years (mean 5.92) | Bilateral HL, 56% (22/39) Unilateral HL, 44% (17/39) |
Consecutive |
Abbreviations: CT, computed tomography; HL, hearing loss; MRI, magnetic resonance imaging; NR, not reported; SNHL, sensorineuronal hearing loss.
Numbers represent data after 1 patient was excluded from the reported results, due to age of 24 years.
Table 8.
Counts and Types of Otological Anomalies Identified by MRI in Children with Unspecified, Uncategorized, or a Range of Hearing Loss.a,i
| Imaging Findings | Ghogomu, 201341 |
McClay, 200827,b |
Preciado, 20047,c |
Clemmens, 201347 |
Simons, 20068 |
Haffey, 201342 |
Miyasaka, 201028 |
Mafong, 200238 |
Tarshish, 201340 |
Kimani, 201048 |
|---|---|---|---|---|---|---|---|---|---|---|
| Inner ear anomalies (combined) | 18% (2/11)d | — | — | — | 7% (1/15) | — | — | — | — | 19% (18/97) |
| Cochlear anomalies | — | 81%e (87/108) | — | 2%f (1/64) | — | — | — | — | — | 39%g (7/18) |
| Mondini malformation | — | — | — | — | — | 10%(1/10) | — | 14% (1/7) | — | — |
| Enlarged vestibular aqueduct | 18% (2/11) | 25% (27/108) | 67% (114/169) | 50% (32/64) | 40% (6/15) | 10% (1/10) | — | 14% (1/7) | 33% (1/3) | 17% (3/18) |
| Vestibular dysplasia | — | — | — | — | — | — | — | — | — | 17% (3/18) |
| “Vestibular abnormality” | — | 22% (24/108) | — | — | — | — | — | — | — | — |
| Endolymphatic sac enlargement | — | 28% (30/108) | — | — | — | — | — | — | — | — |
| Cochlear/IAC nerve anomalies (combined) | — | — | — | — | — | 10% (1/10) | — | — | — | — |
| Cochlear nerve aplasia/absence | 9%h(1/11l)h | 24% (26/108) | — | 30% (19/64) | — | — | 57% (4/7) | — | — | — |
| Cochlear nerve hypoplasia | h | — | 2% (4/169) | 22% (14/64) | 20% (3/15) | — | 43% (3/7) | — | — | — |
| Cochlear nerve dysplasia or “deficiency” | — | 21% (23/108) | 13% (22/169) | — | — | — | — | — | — | 61% (11/18) |
| IAC hypoplasia | — | — | 3% (5/169) | — | — | — | — | — | — | — |
| Vestibule/SCC dysplasia alone | — | — | 2% (1/64) | — | — | — | — | — | — | |
| Small bony island of LSCC/abnormal SCC | — | — | 4% (7/169) | 4% (2/64) | — | — | — | — | — | — |
| Mastoiditis/COM | — | — | — | — | — | 20% (2/10) | — | — | — | — |
| Other findings | 55% (6/11) | — | — | — | — | 10% (1/10) | — | — | 33% (2/3) | — |
| Multiple abnormalities | 9% (1/11) | — | 8% (13/169) | — | — | — | — | — | — | — |
Abbreviations: COM, chronic otitis media; IAC, internal auditory canal; LSCC, lateral semicircular canal; MRI, magnetic resonance imaging; SCC, semicircular canal.
The denominators shown are the number of patients with non-normal MRI findings, with the exception of:
all numbers in ears, rather than patients;
data reported were for CT and MRI combined, out of 616 patients imaged;
includes cochlear and labyrinthine dysplasia;
reported as combined anomalies;
all common cavity findings;
reported as cochlear dysplasia, common cavity;
includes cochlear nerve hypoplasia.
Other findings include large jugular bulb, sinus disease, findings potentially related to cytomegalovirus, or unspecified.
Fifteen studies specifically evaluated brain findings on MRI, with a diagnostic yield of 0% to 37% (Appendix 3A, available at www.otojournal.org). There were a wide range of central nervous system findings, among which white matter findings were frequent (Appendix 3B, available at www.otojournal.org) and heterogeneity among studies was high, even in subgroup analyses. Among the studies of MRI that specified otological/hearing-related findings, the diagnostic yield for those hearing-related findings (excluding incidental and brain-related findings of unclear significance) was 0% to 12%. The yield of incidental findings and brain findings of unclear significance was to 0% to 33%.
Auditory Neuropathy/Auditory Dyssynchrony
Four studies (n = 268 patients) specifically evaluated findings on MRI in patients with auditory spectrum neuropathy (Appendix 4A, 4B, available at www.otojourna-l.org), 1 of which reported comparisons to CT findings.54 The diagnostic yield of MRI in this subgroup ranged from 34% to 100%. Heterogeneity was substantial in this subgroup, except when intracranial diagnoses were considered in a separate subset (Appendix 4C, available at www.otojournal.org). For brain-specific findings, meta-analysis demonstrated a 33% (26%–41%) diagnostic yield (Appendix 4D, available at www.otojournal.org) among children with ANAD.
Study Designs and Risk of Bias
Appendix 5 (available at www.otojournal.org) demonstrates specific aspects of the individual study designs in order to provide summary information that supplements the topic-specific descriptions in the previous text/tables. All in all, less than 15% were prospective or considered inter-rater reliability, less than 40% utilized masking or reported specific diagnostic criteria, and less than 60% described the imaging technique in detail. Consecutive patients, however, were evaluated in nearly 90% of the reports.
Discussion
MRI has been increasingly utilized in the assessment of pediatric hearing loss, and both MRI and CT may provide diagnostic information in children with hearing loss. The aggregate data uncovered in this systematic review and meta-analysis show a wide range of results with substantial heterogeneity within the group at large. Among subgroups defined by diagnostic entity (cochlear anomaly, enlarged vestibular aqueduct, cochlear nerve abnormality), data are more consistent. Subgroup analyses suggest an advantage of CT over MRI in diagnosing enlarged vestibular aqueduct, with a statistically significant, though borderline advantage when diagnosing cochlear anomalies. MRI was favored in the evaluation of the cochlear nerve and brain, although results were statistically nonsignificant in the setting of limited power. The wide confidence intervals in the cochlear nerve analysis suggests that larger sample sizes or decreased heterogeneity among studies might ultimately provide more definitive information in the future.
Some have postulated that the severity of hearing loss may increase the probability of diagnostic yield, but this concept was not demonstrated consistently within these data. The related combined analysis, however, is limited by substantial heterogeneity among studies. Some have also demonstrated the diagnostic imaging findings are more common in children with unilateral rather than bilateral hearing loss,7,8 but the primary data do not allow for a meaningful pooled analysis by hearing laterality.
There were broad variations in the methods, terminology, and report characteristics in the included publications. They were interpretable in a consistent enough way to allow for data analysis, although some may favor reporting standards to make individual studies more overtly comparable. A key source of variability among studies occurs in the diagnostic criteria themselves. Even commonly identified diagnostic entities such as enlarged vestibular aqueduct and cochlear nerve canal narrowing have differing threshold criteria among interpreting radiologists.37,58 Prior studies have shown that simply relying on 2 discrete but widely utilized diagnostic criteria in evaluation of 1 diagnostic entity may result in a nearly 3-fold increase in diagnostic yield.58 The resolution of scanners and imaging protocols may also vary across institutions, and approximately 40% of reports did not specify these parameters. The resolution of CT for bone can be as fine as 0.4 mm, while that of MRI is 1.0 mm.59,60 The resolution for MRI can be increased with higher magnetic fields, and CT is impacted by the temporal and contrast resolution.59,60 While CT is typically optimal for imaging bone, MRI has advantages in assessing soft tissue; each technology may be utilized for specific aspects of the evaluation.61,62
Astutely, the vast majority of comparative publications did not describe the relative sensitivity and specificity of CT in comparison to MRI, given that there is often not a clear, readily accessible gold standard against which to measure both CT and MRI findings. While posthumous otopathological study63 and surgically demonstrated findings might be utilized as a gold standard against which to measure both imaging techniques, these are often logistically infeasible within a short timeframe. Ultimately, the posthumous combination of otopathologically confirmed micro-CT specimens may define such a gold standard but would depend on continued funding for the key work done by the few remaining national temporal bone registries. The underlying data directly comparing CT and MRI are still limited in number, and future studies will provide needed information, particularly as imaging science becomes more and more sophisticated.
The decision to pursue MRI, CT, both, or neither incorporates not only an understanding of the potential diagnostic yield but also the associated risks of each. CT-related diagnostic yield was assessed in a related systematic review and estimated at 30%, with an associated number needed to treat of 4. CT-related radiation risks in imaging of the head and neck have been addressed in detail in a systematic review as well, and current best evidence suggests that brain malignancy may arise in 1 in 4000 brain CTs64 while the risk of thyroid cancer after temporal bone CT is 4 to 8 per 1,000,000.65
MRI-related risks are mainly due to the associated need for sedation in younger children and somewhat to the concomitant administration of gadolinium. Large studies have suggested that 1 in 400 sedations are associated with stridor, laryngospasm, wheezing, or apnea that might progress to a poor outcome, while 1 in 200 may require an airway intervention ranging from bag-mask ventilation to urgent intubation.66,67 Approximately 1% of sedated patients will develop a potentially serious complication requiring resuscitative interventions.67,68 MRI imaging itself has generally been considered safe, although some data suggest the induction of various genetic pathways by scans both in vitro and in vivo; the implications of these findings are not yet known.69 Among the more common related injuries are those arising from projectiles and superficial burns, which have become uncommon with proper precautions.70,71 The risk of adverse effects after gadolinium has been cited as 0.04% to 2.4%, the majority of which are mild.72–74 Nephrogenic systemic fibrosis is a condition in which scleroderma-like changes occur in the skin, internal organs, eyes, and blood vessels.75 It is classically seen when contrast agents are given to patients in renal failure and is typically not in the presence of normal kidney function. The condition is very infrequent in the pediatric population (less than 10 reported cases as of 2008); the youngest patient reported with this condition was 8 years old, and all children reported have had known renal problems.76,77 While the American College of Radiology has suggested that the same guidelines for contrast administration be used for children and adults, they advise caution in neonates, infants, and very young children, in association with their immature renal systems.76
Imaging decisions also raise several key management issues for infants, children, and adolescents with hearing loss, particularly among those who are profoundly affected in both ears. Uncovering associated diagnoses may guide patient management and prognostic expectations. In particular, an absent cochlear nerve canal impacts cochlear implant candidacy and has related prognostic implications.78,79 In addition, once cochlear implantation has been completed, MRI can no longer provide meaningful diagnostics for that ear due to the implant-associated image distortion. Also, preparation for MRI after implantation requires addressing the internal magnet, which involves an additional procedure. Therefore, prior to performing cochlear implantation, if there is any potential for future need of information gleaned specifically from an MRI, consider performing it prior to implantation.
Some physicians are proponents of MRI over CT,5 while others note that CT may be superior.7,8 Meanwhile, some caregivers espouse ordering both CT and MRI in pediatric patients with hearing loss, feeling it is worth the added expense and dual risk of radiation and sedation. Other clinicians decide according to age, severity, or laterality of a given patient’s presentation. In addition, findings associated with auditory neuropathy may influence the choice.10 Better understanding the relative and diagnosis-specific potential yields of CT and MRI will allow us to increase the sophistication with which we order these studies. For example, if enlarged vestibular aqueduct is the main diagnostic concern, then the body of current best evidence suggests that CT is better suited. Increasing the nuance and quantitative aspect of our understanding also creates a strong foundation for both population-based decision analysis and shared, informed decision making80–82 with families in circumstances where the risks and benefits of imaging choices are weighed together.
Supplementary Material
Acknowledgments
We would like to thank Laura Vitale Romo, MD (Department of Radiology, Harvard Medical School), for input on imaging characteristics and definitions to faciliate decisions regarding criteria-meeting studies. J.J.S. would also like to thank Thomas Y. Lin and Creating Healthcare Excellence through Education and Research for support during the preparation of this manuscript.
Footnotes
Supplemental Material
Additional supporting information may be found at http://otojournal.org/supplemental.
Author Contributions
Bart Kachniarz, analysis, interpretation, drafts, final approval; Jenny X. Chen, analysis, interpretation, drafts, final approval; Sapideh Gilani, acquisition of data, drafts, final approval; Jennifer J. Shin, concept, design, analysis, interpretation, drafts, final approval.
Disclosures
Competing interests: Jennifer J. Shin, receives royalties from the publication of 2 books: Evidence-based Otolaryngology (Springer International), Otolaryngology Prep and Practice (Plural Publishing).
Sponsorships: None.
Funding source: None.
Sponsorships or competing interests that may be relevant to content are disclosed at the end of this article.
References
- 1.Shargorodsky J, Curhan SG, Curhan GC, Eavey R. Change in prevalence of hearing loss in US adolescents. JAMA. 2010;304:772–778. doi: 10.1001/jama.2010.1124. [DOI] [PubMed] [Google Scholar]
- 2.Mehra S, Eavey RD, Keamy DG., Jr The epidemiology of hearing impairment in the United States: newborns, children, and adolescents. Otolaryngol Head Neck Surg. 2009;140:461–472. doi: 10.1016/j.otohns.2008.12.022. [DOI] [PubMed] [Google Scholar]
- 3.Niskar AKS. Prevalence of hearing loss among children 6 to 19 years of age: the third national health and nutrition examination survey. JAMA. 1998;279:1071–1075. doi: 10.1001/jama.279.14.1071. [DOI] [PubMed] [Google Scholar]
- 4.Ellul S, Shelton C, Davidson HC, Harnsberger HR. Preoperative cochlear implant imaging: is magnetic resonance imaging enough? Am J Otol. 2000;21:528–533. [PubMed] [Google Scholar]
- 5.Parry DA, Booth T, Roland PS. Advantages of magnetic resonance imaging over computed tomography in preoperative evaluation of pediatric cochlear implant candidates. Otol Neurotol. 2005;26:976–982. doi: 10.1097/01.mao.0000185049.61770.da. [DOI] [PubMed] [Google Scholar]
- 6.Preciado DA, Lawson L, Madden C, et al. Improved diagnostic effectiveness with a sequential diagnostic paradigm in idiopathic pediatric sensorineural hearing loss. Otol Neurotol. 2005;26:610–615. doi: 10.1097/01.mao.0000178133.89353.1d. [DOI] [PubMed] [Google Scholar]
- 7.Preciado DA, Lim LHY, Cohen AP, et al. A diagnostic paradigm for childhood idiopathic sensorineural hearing loss. Otolaryngol Head Neck Surg. 2004;131:804–809. doi: 10.1016/j.otohns.2004.06.707. [DOI] [PubMed] [Google Scholar]
- 8.Simons JP, Mandell DL, Arjmand EM. Computed tomography and magnetic resonance imaging in pediatric unilateral and asymmetric sensorineural hearing loss. Arch Otolaryngol Head Neck Surg. 2006;132:186–192. doi: 10.1001/archotol.132.2.186. [DOI] [PubMed] [Google Scholar]
- 9.Huo L, Wang H. Characteristics and application of inner ear CT in 20 cases of sensorineural hearing loss in children. Acta oto-laryngologica. 2012;132:1261–1265. doi: 10.3109/00016489.2012.702354. [DOI] [PubMed] [Google Scholar]
- 10.Licameli G, Kenna MA. Is computed tomography (CT) or magnetic resonance imaging (MRI) more useful in the evaluation of pediatric sensorineural hearing loss? Laryngoscope. 2010;120:2358–2359. doi: 10.1002/lary.21363. [DOI] [PubMed] [Google Scholar]
- 11.Crowther M, Lim W, Crowther MA. Systematic review and meta-analysis methodology. Blood. 2010;116:3140–3146. doi: 10.1182/blood-2010-05-280883. [DOI] [PubMed] [Google Scholar]
- 12.Shin JJ, Hartnick CJ. Introduction to evidence based medicine. In: Shin JJ, Hartnick CJ, Randolph GW, editors. Evidence-based Otolaryngology. New York: Springer; 2008. [Google Scholar]
- 13.Uthman OA, Okwundu CI, Wiysonge CS, Young T, Clarke A. Citation classics in systematic reviews and meta-analyses: who wrote the top 100 most cited articles? PLoS One. 2013;8:e78517. doi: 10.1371/journal.pone.0078517. [DOI] [PMC free article] [PubMed] [Google Scholar]
- 14.Sackett DL, Straus SE, Richardson WS, Rosenberg W, Haynes RB. Evidence Based Medicine: How to Practice and Teach EBM. London: Churchill Livingstone; 1997. [Google Scholar]
- 15.Rosenfeld RM. How to systematically review the medical literature. Otolaryngol Head Neck Surg. 1996;115:53–63. doi: 10.1016/S0194-5998(96)70137-7. [DOI] [PubMed] [Google Scholar]
- 16.Rosenfeld RM. Meta-analysis. ORL J Otorhinolaryngol Relat Spec. 2004;66:186–195. doi: 10.1159/000079876. [DOI] [PubMed] [Google Scholar]
- 17.Bero L, Busuttil G, Farquhar C, et al. Measuring the performance of the Cochrane library. Cochrane Database Syst Rev. 2012;12:ED000048. doi: 10.1002/14651858.ED000048. [DOI] [PMC free article] [PubMed] [Google Scholar]
- 18.Chen JX, Karniaz BSG, Shin JJ. The diagnostic yield of CT scan for pediatric hearing loss: a systematic review [published online September 3, 2014] Otolaryngol Head Neck Surg. doi: 10.1177/0194599814545727. [DOI] [PMC free article] [PubMed] [Google Scholar]
- 19.Chen JX, Karniaz BSG, Shin JJ. Risk of malignancy of pediatric CT scan of the head and neck: a systematic review. Otolaryngol Head Neck Surg. 2014;151(4):554–566. doi: 10.1177/0194599814542588. [DOI] [PMC free article] [PubMed] [Google Scholar]
- 20.Tsukamoto K, Suzuki H, Harada D, Namba A, Abe S, Usami S. Distribution and frequencies of PDS (SLC26A4) mutations in Pendred syndrome and nonsyndromic hearing loss associated with enlarged vestibular aqueduct: a unique spectrum of mutations in Japanese. Eur J Hum Genet. 2003;11:916–922. doi: 10.1038/sj.ejhg.5201073. [DOI] [PubMed] [Google Scholar]
- 21.Reardon WCFOM, Trembath R, Jan H, Phelps PD. Enlarged vestibular aqueduct: a radiological marker of pendred syndrome, and mutation of the PDS gene. QJM. 2000;93:99–104. doi: 10.1093/qjmed/93.2.99. [DOI] [PubMed] [Google Scholar]
- 22.Juni P, Witschi A, Bloch R, Egger M. The hazards of scoring the quality of clinical trials for meta-analysis. JAMA. 1999;282:1054–1060. doi: 10.1001/jama.282.11.1054. [DOI] [PubMed] [Google Scholar]
- 23.Sharpe D. Of apples and oranges, file drawers and garbage: why validity issues in meta-analysis will not go away. Clin Psychol Rev. 1997;17:881–901. doi: 10.1016/s0272-7358(97)00056-1. [DOI] [PubMed] [Google Scholar]
- 24.Armijo-Olivo S, Stiles CR, Hagen NA, Biondo PD, Cummings GG. Assessment of study quality for systematic reviews: a comparison of the Cochrane Collaboration Risk of Bias Tool and the Effective Public Health Practice Project Quality Assessment Tool: methodological research. J Eval Clin Practice. 2012;18:12–18. doi: 10.1111/j.1365-2753.2010.01516.x. [DOI] [PubMed] [Google Scholar]
- 25.Hartling L, Ospina M, Liang Y, et al. Risk of bias versus quality assessment of randomised controlled trials: cross sectional study. BMJ. 2009;339:b4012. doi: 10.1136/bmj.b4012. [DOI] [PMC free article] [PubMed] [Google Scholar]
- 26.Bossuyt PM, Reitsma JB, Bruns DE, et al. Towards complete and accurate reporting of studies of diagnostic accuracy: the STARD initiative. BMJ. 2003;326:41–44. doi: 10.1136/bmj.326.7379.41. [DOI] [PMC free article] [PubMed] [Google Scholar]
- 27.McClay JE, Booth TN, Parry DA, Johnson R, Roland P. Evaluation of pediatric sensorineural hearing loss with magnetic resonance imaging. Arch Otolaryngol Head Neck Surg. 2008;134:945–952. doi: 10.1001/archotol.134.9.945. [DOI] [PubMed] [Google Scholar]
- 28.Miyasaka M, Nosaka S, Morimoto N, Taiji H, Masaki H. CT and MR imaging for pediatric cochlear implantation: emphasis on the relationship between the cochlear nerve canal and the cochlear nerve. Pediatric Rad. 2010;40:1509–1516. doi: 10.1007/s00247-010-1609-7. [DOI] [PubMed] [Google Scholar]
- 29.Kong WJ, Cheng HM, Wang YJ, et al. Integrated profile to assess auditory nerve-auditory pathway integrity. ORL J Otorhinolaryngol Relat Spec. 2009;71:196–208. doi: 10.1159/000229298. [DOI] [PubMed] [Google Scholar]
- 30.Higgins JP, Thompson SG. Quantifying heterogeneity in a meta-analysis. Stat Med. 2002;21:1539–1558. doi: 10.1002/sim.1186. [DOI] [PubMed] [Google Scholar]
- 31.Higgins JP, Green S. Cochrane Handbook for Systematic Reviews of Interventions. The Cochrane Collaboration; 2008. Located at. [Google Scholar]
- 32.Borenstein M. Introduction to Meta-analysis. Chichester, UK: John Wiley & Sons; 2009. [Google Scholar]
- 33.Freeman MF, Tukey JW. Transformations related to the angular and the square root. Ann Math Stat. 1950;21:607–611. [Google Scholar]
- 34.DerSimonian R, Laird N. Meta-analysis in clinical trials. Control Clin Trials. 1986;7:177–188. doi: 10.1016/0197-2456(86)90046-2. [DOI] [PubMed] [Google Scholar]
- 35.Egger M, Davey Smith G, Schneider M, Minder C. Bias in meta-analysis detected by a simple, graphical test. BMJ. 1997;315:629–634. doi: 10.1136/bmj.315.7109.629. [DOI] [PMC free article] [PubMed] [Google Scholar]
- 36.Declau F, Boudewyns A, Van den Ende J, Peeters A, van den Heyning P. Etiologic and audiologic evaluations after universal neonatal hearing screening: analysis of 170 referred neonates. Pediatrics. 2008;121:1119–1126. doi: 10.1542/peds.2007-1479. [DOI] [PubMed] [Google Scholar]
- 37.Komatsubara S, Haruta A, Nagano Y, Kodama T. Evaluation of cochlear nerve imaging in severe congenital sensorineural hearing loss. ORL J Otorhinolaryngol Relat Spec. 2007;69:198–202. doi: 10.1159/000099231. [DOI] [PubMed] [Google Scholar]
- 38.Mafong DD, Shin EJ, Lalwani AK. Use of laboratory evaluation and radiologic imaging in the diagnostic evaluation of children with sensorineural hearing loss. Laryngoscope. 2002;112:1–7. doi: 10.1097/00005537-200201000-00001. [DOI] [PubMed] [Google Scholar]
- 39.Ohlms LA, Chen AY, Stewart MG, Franklin DJ. Establishing the etiology of childhood hearing loss. Otolaryngol Head Neck Surg. 1999;120:159–163. doi: 10.1016/S0194-5998(99)70400-6. [DOI] [PubMed] [Google Scholar]
- 40.Tarshish Y, Leschinski A, Kenna M. Pediatric sudden sensorineural hearing loss: diagnosed causes and response to intervention. Int J Pediatr Otorhinolaryngol. 2013;77:553–559. doi: 10.1016/j.ijporl.2013.01.004. [DOI] [PubMed] [Google Scholar]
- 41.Ghogomu N, Umansky A, Lieu JEC. Epidemiology of unilateral sensorineural hearing loss with universal newborn hearing screening. Laryngoscope. 2014;124:295–300. doi: 10.1002/lary.24059. [DOI] [PMC free article] [PubMed] [Google Scholar]
- 42.Haffey T, Fowler N, Anne S. Evaluation of unilateral sensorineural hearing loss in the pediatric patient. Int J Pediatr Otorhinolaryngol. 2013;77:955–958. doi: 10.1016/j.ijporl.2013.03.015. [DOI] [PubMed] [Google Scholar]
- 43.Young NM, Kim FM, Ryan ME, Tournis E, Yaras S. Pediatric cochlear implantation of children with eighth nerve deficiency. Int J Pediatr Otorhinolaryngol. 2012;76:1442–1448. doi: 10.1016/j.ijporl.2012.06.019. [DOI] [PubMed] [Google Scholar]
- 44.Fahy CP, Carney AS, Nikolopoulos TP, Ludman CN, Gibbin KP. Cochlear implantation in children with large vestibular aqueduct syndrome and a review of the syndrome. Int J Pediatr Otorhinolaryngol. 2001;59:207–215. doi: 10.1016/s0165-5876(01)00487-6. [DOI] [PubMed] [Google Scholar]
- 45.Russo EE, Manolidis S, Morriss MC. Cochlear nerve size evaluation in children with sensorineural hearing loss by high-resolution magnetic resonance imaging. Am J Otolaryngol. 2006;27:166–172. doi: 10.1016/j.amjoto.2005.09.007. [DOI] [PubMed] [Google Scholar]
- 46.Lapointe A, Viamonte C, Morriss MC, Manolidis S. Central nervous system findings by magnetic resonance in children with profound sensorineural hearing loss. Int J Pediatr Otorhinolaryngol. 2006;70:863–868. doi: 10.1016/j.ijporl.2005.09.022. [DOI] [PubMed] [Google Scholar]
- 47.Clemmens CS, Guidi J, Caroff A, et al. Unilateral cochlear nerve deficiency in children. Otolaryngol Head Neck Surg. 2013;149:318–325. doi: 10.1177/0194599813487681. [DOI] [PubMed] [Google Scholar]
- 48.Kimani JW, Buchman CA, Booker JK, et al. Sensorineural hearing loss in a pediatric population: association of congenital cytomegalovirus infection with intracranial abnormalities. Arch Otolaryngol Head Neck Surg. 2010;136:999–1004. doi: 10.1001/archoto.2010.156. [DOI] [PubMed] [Google Scholar]
- 49.Brookhouser PE, Worthington DW, Kelly WJ. Unilateral hearing loss in children. Laryngoscope. 1991;101:1264–1272. doi: 10.1002/lary.5541011202. [DOI] [PubMed] [Google Scholar]
- 50.Jonas NE, Ahmed J, Grainger J, et al. MRI brain abnormalities in cochlear implant candidates: how common and how important are they? Int J Pediatr Otorhinolaryngol. 2012;76:927–929. doi: 10.1016/j.ijporl.2012.02.070. [DOI] [PubMed] [Google Scholar]
- 51.McClay JE, Tandy R, Grundfast K, et al. Major and minor temporal bone abnormalities in children with and without congenital sensorineural hearing loss. Arch Otolaryngol Head Neck Surg. 2002;128:664–671. doi: 10.1001/archotol.128.6.664. [DOI] [PubMed] [Google Scholar]
- 52.Hong P, Jurkowski ZC, Carvalho DS. Preoperative cerebral magnetic resonance imaging and white matter changes in pediatric cochlear implant recipients. Int J Pediatr Otorhinolaryngol. 2010;74:658–660. doi: 10.1016/j.ijporl.2010.03.014. [DOI] [PubMed] [Google Scholar]
- 53.Huang BY, Roche JP, Buchman CA, Castillo M. Brain stem and inner ear abnormalities in children with auditory neuropathy spectrum disorder and cochlear nerve deficiency. AJNR Am J Neuroradiol. 2010;31:1972–1979. doi: 10.3174/ajnr.A2178. [DOI] [PMC free article] [PubMed] [Google Scholar]
- 54.Roche JP, Huang BY, Castillo M, Bassim MK, Adunka OF, Buchman CA. Imaging characteristics of children with auditory neuropathy spectrum disorder. Otol Neurotol. 2010;31:780–788. doi: 10.1097/mao.0b013e3181d8d528. [DOI] [PMC free article] [PubMed] [Google Scholar]
- 55.Teagle HF, Roush PA, Woodard JS, et al. Cochlear implantation in children with auditory neuropathy spectrum disorder. Ear Hear. 2010;31:325–335. doi: 10.1097/AUD.0b013e3181ce693b. [DOI] [PubMed] [Google Scholar]
- 56.Laury AM, Casey S, McKay S, Germiller JA. Etiology of unilateral neural hearing loss in children. Int J Pediatr Otorhinolaryngol. 2009;73:417–427. doi: 10.1016/j.ijporl.2008.11.012. [DOI] [PubMed] [Google Scholar]
- 57.Trimble K, Blaser S, James AL, Papsin BC. Computed tomography and/or magnetic resonance imaging before pediatric cochlear implantation? Developing an investigative strategy. Otol Neurotol. 2007;28:317–324. doi: 10.1097/01.mao.0000253285.40995.91. [DOI] [PubMed] [Google Scholar]
- 58.Dewan K, Wippold FJ, II, Lieu JEC. Enlarged vestibular aqueduct in pediatric sensorineural hearing loss. Otolaryngol Head Neck Surg. 2009;140:552–558. doi: 10.1016/j.otohns.2008.12.035. [DOI] [PMC free article] [PubMed] [Google Scholar]
- 59.Rockwood CA, Green DP, Bucholz RW. Rockwood and Green’s Fractures in Adults. 7. Philadelphia, PA: Wolters Kluwer Health/Lippincott, Williams & Wilkins; 2010. [Google Scholar]
- 60.Lin E, Alessio A. What are the basic concepts of temporal, contrast, and spatial resolution in cardiac CT? J Cardiovasc Comput Tomogr. 2009;3:403–408. doi: 10.1016/j.jcct.2009.07.003. [DOI] [PMC free article] [PubMed] [Google Scholar]
- 61.Yip YP, Capriotti C, Norbash SG, Talagala SL, Yip JW. Effects of MR exposure on cell proliferation and migration of chick motoneurons. J Magn Reson Imaging. 1994;4:799–804. doi: 10.1002/jmri.1880040610. [DOI] [PubMed] [Google Scholar]
- 62.Dammann F, Bootz F, Cohnen M, Hassssfeld S, Tatagiba M, Kosling S. Diagnostic imaging modalities in head and neck disease. Deutsches Arzteblatt international. 2014;111:417–423. doi: 10.3238/arztebl.2014.0417. [DOI] [PMC free article] [PubMed] [Google Scholar]
- 63.Quesnel AM, Moonis G, Appel J, et al. Correlation of computed tomography with histopathology in otosclerosis. Otol Neurotol. 2013;34:22–28. doi: 10.1097/MAO.0b013e318277a1f7. [DOI] [PMC free article] [PubMed] [Google Scholar]
- 64.Mathews JD, Forsythe AV, Brady Z, et al. Cancer risk in 680 000 people exposed to computed tomography scans in childhood or adolescence: data linkage study of 11 million Australians. BMJ (Clinical research ed) 2013;346:f2360. doi: 10.1136/bmj.f2360. [DOI] [PMC free article] [PubMed] [Google Scholar]
- 65.Mazonakis M, Tzedakis A, Damilakis J, Gourtsoyiannis N. Thyroid dose from common head and neck CT examinations in children: is there an excess risk for thyroid cancer induction? European radiology. 2007;17:1352–1357. doi: 10.1007/s00330-006-0417-9. [DOI] [PubMed] [Google Scholar]
- 66.Cravero JP. Risk and safety of pediatric sedation/anesthesia for procedures outside the operating room. Curr Opin Anaesthesiol. 2009;22:509–513. doi: 10.1097/ACO.0b013e32832dba6e. [DOI] [PubMed] [Google Scholar]
- 67.Cravero JP, Blike GT, Beach M, et al. Incidence and nature of adverse events during pediatric sedation/anesthesia for procedures outside the operating room: report from the Pediatric Sedation Research Consortium. Pediatrics. 2006;118:1087–1096. doi: 10.1542/peds.2006-0313. [DOI] [PubMed] [Google Scholar]
- 68.Serafini G, Zadra N. Anaesthesia for MRI in the paediatric patient. Curr Opin Anaesthesiol. 2008;21:499–503. doi: 10.1097/ACO.0b013e328304115b. [DOI] [PubMed] [Google Scholar]
- 69.Arthurs OJ, Bjorkum AA. Safety in pediatric imaging: an update. Acta Radiol. 2013;54:983–990. doi: 10.1177/0284185113477399. [DOI] [PubMed] [Google Scholar]
- 70.Schmidt MH, Marshall J, Downie J, Hadskis MR. Pediatric magnetic resonance research and the minimal-risk standard. IRB. 2011;33:1–6. [PubMed] [Google Scholar]
- 71.Marshall J, Martin T, Downie J, Malisza K. A comprehensive analysis of MRI research risks: in support of full disclosure. Can J Neurol Sci. 2007;34:11–17. doi: 10.1017/s0317167100005734. [DOI] [PubMed] [Google Scholar]
- 72.Shellock FG. MRI contrast agents and adverse reactions. 2014 http://www.mrisafety.com/SafetyInfov.asp?SafetyInfoID=245.
- 73.Dillman JR, Ellis JH, Cohan RH, Strouse PJ, Jan SC. Frequency and severity of acute allergic-like reactions to gadolinium-containing i.v. contrast media in children and adults. AJR Am J Roentgenol. 2007;189:1533–1538. doi: 10.2214/AJR.07.2554. [DOI] [PubMed] [Google Scholar]
- 74.Jung JW, Kang HR, Kim MH, et al. Immediate hypersensitivity reaction to gadolinium-based MR contrast media. Radiology. 2012;264:414–422. doi: 10.1148/radiol.12112025. [DOI] [PubMed] [Google Scholar]
- 75.Crownover BK, Bepko JL. Appropriate and safe use of diagnostic imaging. Am Fam Physician. 2013;87:494–501. [PubMed] [Google Scholar]
- 76.ACR-Committee-on-Drugs-and-Contrast-Media. ACR Manual on Contrast Media, Version 9. 2013;51 [Google Scholar]
- 77.Coley BD. Caffey’s Pediatric Diagnostic Imaging. 12. Philadelphia: Elsevier Saunders; 2013. [Google Scholar]
- 78.Wilkins APS. Frequent association of cochlear nerve canal stenosis with pediatric sensorineural hearing loss. Arch Otolaryngol Head Neck Surg. 2012;138:383–388. doi: 10.1001/archoto.2012.237. [DOI] [PubMed] [Google Scholar]
- 79.Colletti V, Shannon RV, Carner M, Veronese S, Colletti L. Progress in restoration of hearing with the auditory brainstem implant. Progress in Brain Research. 2009;175:333–345. doi: 10.1016/S0079-6123(09)17523-4. [DOI] [PubMed] [Google Scholar]
- 80.Makoul G, Clayman ML. An integrative model of shared decision making in medical encounters. Patient Educ Couns. 2006;60:301–312. doi: 10.1016/j.pec.2005.06.010. [DOI] [PubMed] [Google Scholar]
- 81.Barry MJ, Edgman-Levitan S. Shared decision making—pinnacle of patient-centered care. N Engl J Med. 2012;366:780–781. doi: 10.1056/NEJMp1109283. [DOI] [PubMed] [Google Scholar]
- 82.Oshima Lee E, Emanuel EJ. Shared decision making to improve care and reduce costs. N Engl J Med. 2013;368:6–8. doi: 10.1056/NEJMp1209500. [DOI] [PubMed] [Google Scholar]
- 83.Lin JW, Chowdhury N, Mody A, et al. Comprehensive Diagnostic Battery for Evaluating Sensorineural Hearing Loss in Children. Otol Neurotol. 2011;32:259–264. doi: 10.1097/MAO.0b013e31820160fa. [DOI] [PMC free article] [PubMed] [Google Scholar]
- 84.Whittemore KR, Jr, Dornan BK, Lally T, Dargie JM. Persistent conductive or mixed hearing loss after the placement of tympanostomy tubes. Int J Pediatr Otorhinolaryngol. 2012;76:1465–1470. doi: 10.1016/j.ijporl.2012.06.022. [DOI] [PubMed] [Google Scholar]
Associated Data
This section collects any data citations, data availability statements, or supplementary materials included in this article.