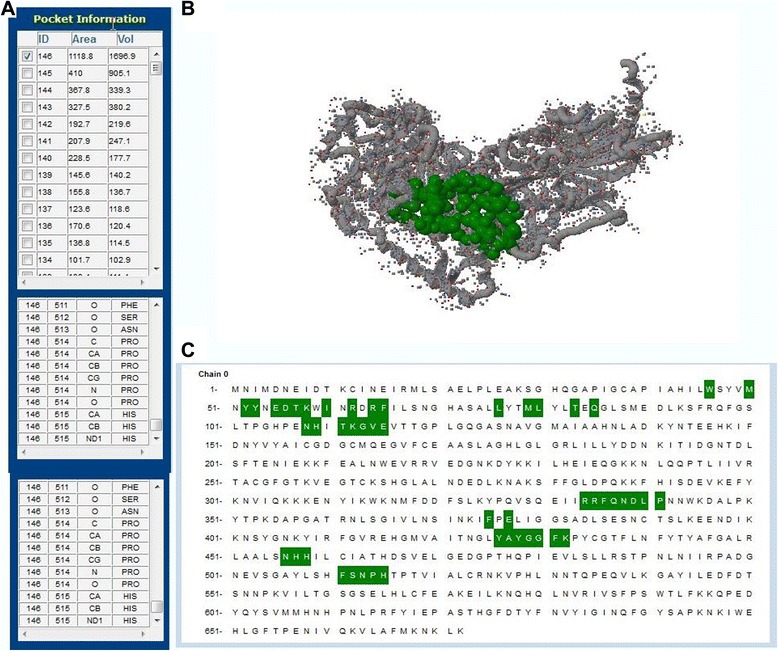
Fig. 10.

a The table of the area and the volume for different active sites of transketolase. b The Three Dimensional structure of the best active site. c Active site analysis by CASTp server. Green color illustrates the active site position from 46 to 515 with the beta-sheet in connecting them
