Fig. 9.

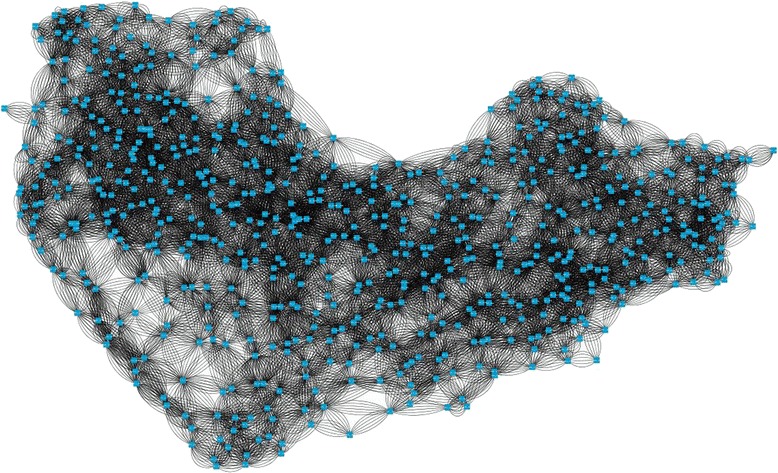
Residue interaction network generated by RING was visualized by Cytoscape. Here, nodes represent amino acids and edges represent interaction

Residue interaction network generated by RING was visualized by Cytoscape. Here, nodes represent amino acids and edges represent interaction