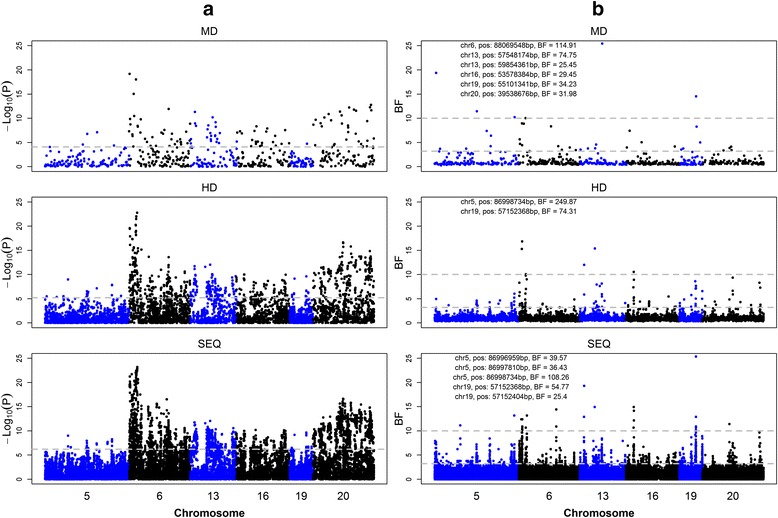
Fig. 1.

Genome-wide plot for association of SNPs with udder health. (a) Plots generated by the LM model based on MD, HD, and SEQ data. (b) Plots generated by BVS model based on MD, HD, and SEQ data. Six chromosome regions between 84 and 95 Mb on BTA5, 88 and 96 Mb on BTA6, 57 and 63 Mb on BTA13, 48 and 55 Mb on BTA16, 55 and 58 Mb on BTA19, and 32 and 40 Mb on BTA20 are marked in alternating colors for clarity. The vertical axis is − log10(P) for the LM and BF for the BVS model, respectively; the horizontal dotted line indicates the genome-wide significance levels (for BVS, 3.2 is considered as putative and 10 is considered as strong evidence); the text on the subfigures presents the significant SNPs that were detected by the BVS model with a BF greater than 25
