Fig. 6.

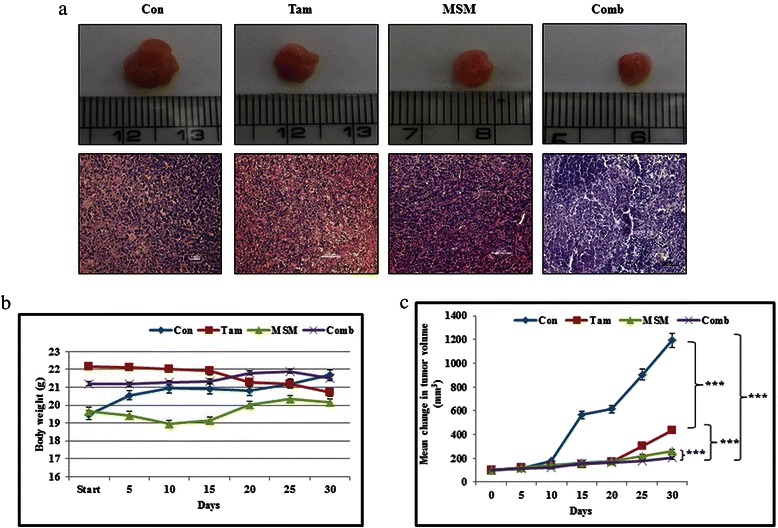
The combination of Tam and MSM inhibited tumor growth. (a) Panel 1 represents the xenograft model showing the tumor size obtained following treatment with Tam, MSM, or the drug combination. Panel 2 represents the morphological analysis of tumors by H&E staining. (b) Body weight analysis for drug-treated and vehicle-treated mice for a period of 30 days. (c) Graphical representation of the tumor size analysis for vehicle-treated controls, and Tam, MSM, or drug combination-treated mice during 30 days of treatment. Statistical analyses were conducted using the ANOVA test (***P < 0.001)
