
Fig. 3.
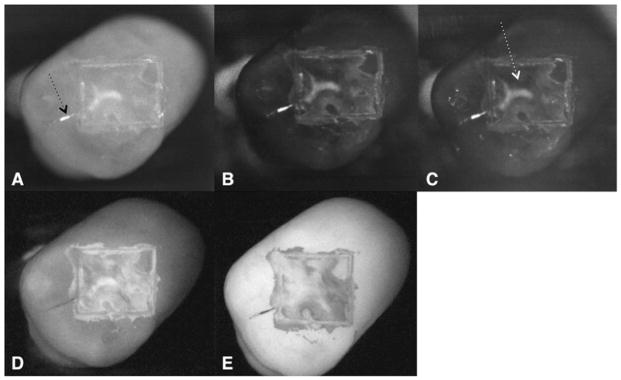
Occlusal images of 1-day lesions are shown for one sample: near-IR reflectance images w/crossed polarizer’s, (A) 1,300 nm, (B) 1,460 nm, and (C) 1,600 nm, along with (D) visible reflectance image w/crossed polarizers and (E) fluorescence image. Note the high contrast area of more severe demineralization in the near-IR images (white arrow in [C]) along with the residual natural demineralization and stain outside the 4 × 4 mm window (black arrow in [A]).