
Fig. 5.
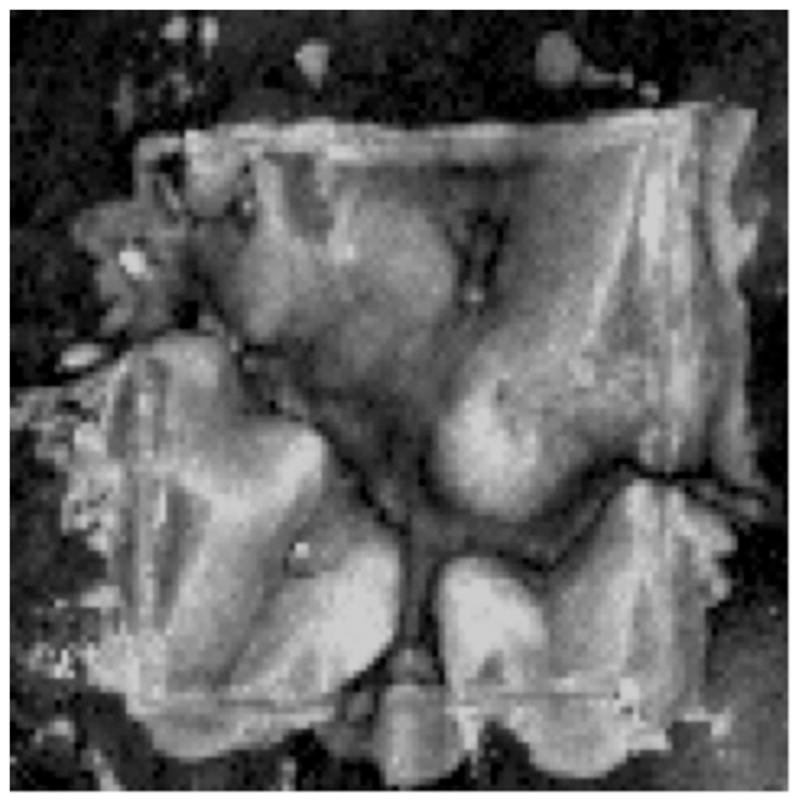
Image of the integrated reflectivity calculated from the PS-OCT image for the same tooth shown in Figure 4. Whiter areas are indicative of a high-integrated reflectivity with lesion depth, representing more severe demineralization, while black represents areas of less demineralization, image is 125 × 107 pixels.