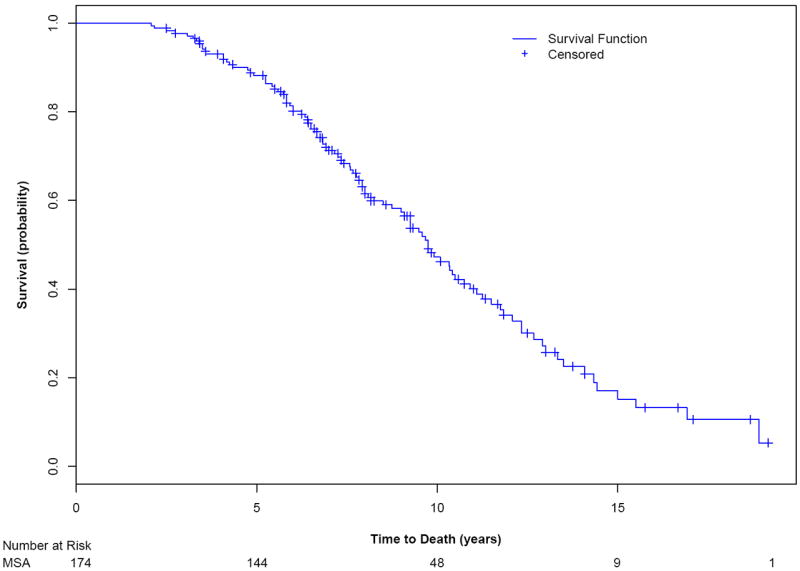
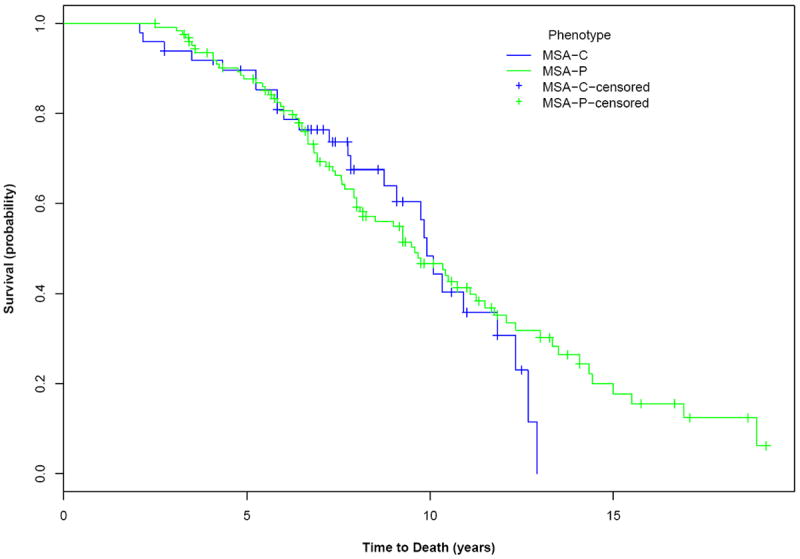
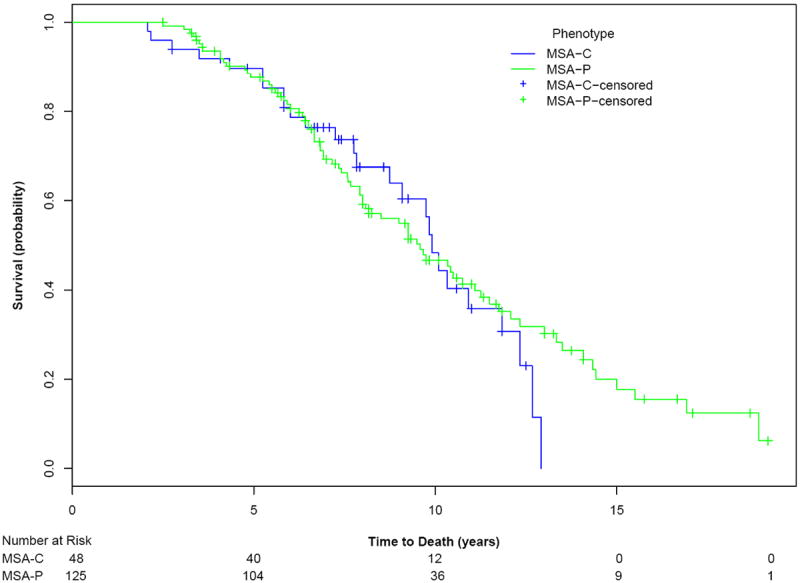
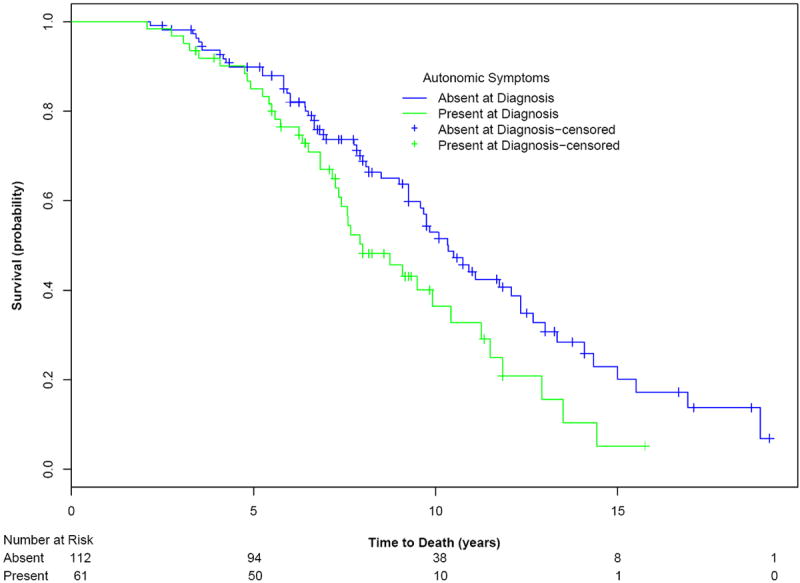
Figure 2.


Kaplan-Meier survival curves for probability of dying (upper curve) in all subjects with MSA; and (middle curve) in subjects with MSA-P compared with those with MSA-C, MSAP, and (lower curve) subjects with severe symptomatic autonomic failure at diagnosis compared with those without severe symptomatic autonomic failure at diagnosis. Number at risk of subjects for selected time-points is provided.
