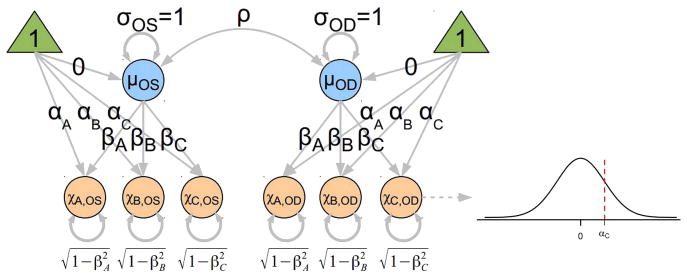
Figure 2.

Simplified path diagram illustrating the common factor agreement model used in this study. Double-ended curved arrows denote correlations. The ‘true’, but unobserved, progression (μ) for the right (μOD) and left (μOS) eyes is assumed to be on a continuous scale, normally distributed with mean of zero and SD of one. The orange circles denote the unobserved judgements χ made by each grader on a continuous scale. The grader bias is described by the intercept α and the scale factor (slope) β. A nonlinear transformation (denoted by the dashed path pointing from χC,OD to the normal distribution) converts the continuous measurement into the dichotomous observation—values below the intercept α are non-progressors and those above the intercept are progressors. The true progression for eyes is correlated as denoted by ρ. Because the latent variables for progression (μ) and the unobserved continuous ratings (χ) are constrained to have variances of one and means of zero, the factor loadings β can be interpreted as tetrachoric correlation coefficients. As a consequence of these constraints, the variance of the residual error is constrained to be equal to one minus the corresponding squared correlation coefficient (1–β2).
