
Fig. 2.
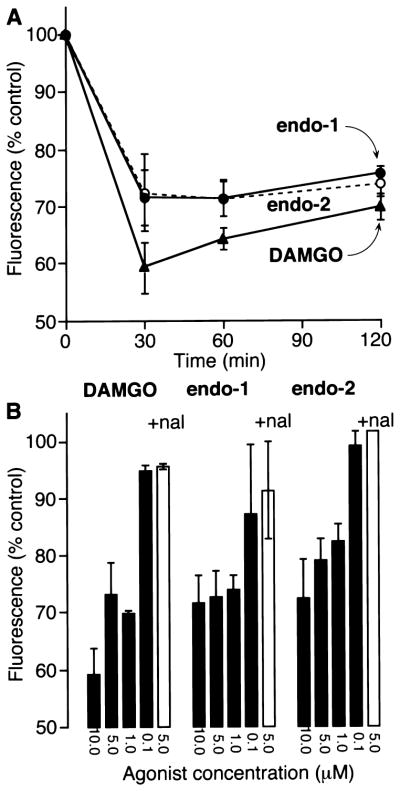
Quantification of surface MOR in KNRK-MOR cells by flow cytometry. (A) Cells were incubated with 10 μM endomorphin-1, endomorphin-2 or DAMGO for 0–120 min. (B) Cells were incubated with 0.1–10 μM endomorphin-1, endomorphin-2 or DAMGO for 30 min (filled bars) or with 5 μM agonists and 1 μM naloxone (open bars). Surface MOR was quantified by flow cytometry using an M2 antibody to the extracellular FLAG epitope. Results are expressed as percentage of surface fluorescence detected in untreated cells and are the mean ± S.E. of duplicate observations from three to five experiments.