
Fig. 4.
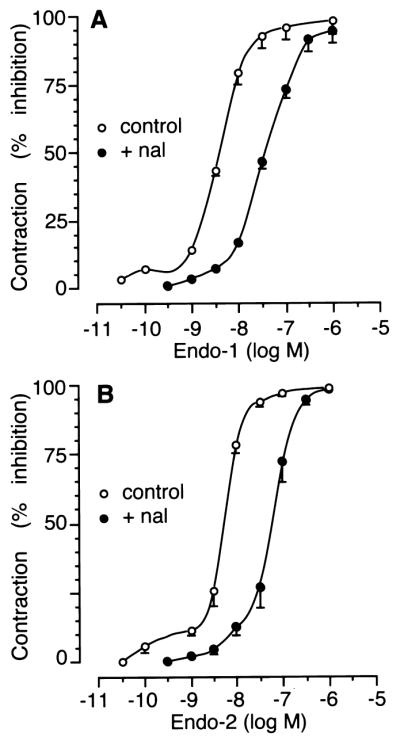
Concentration–response curves for the inhibitory effect of endomorphin-1 (A) and endomorphin-2 (B) on stimulated contractions in the longitudinal muscle–myenteric plexus preparation under control conditions (open symbols) or in the presence of 30 nM naloxone (filled symbols). Values are expressed as the mean ± S.E. of four to five determinations.