
Figure. 1. Food and energy intake ± SEM.
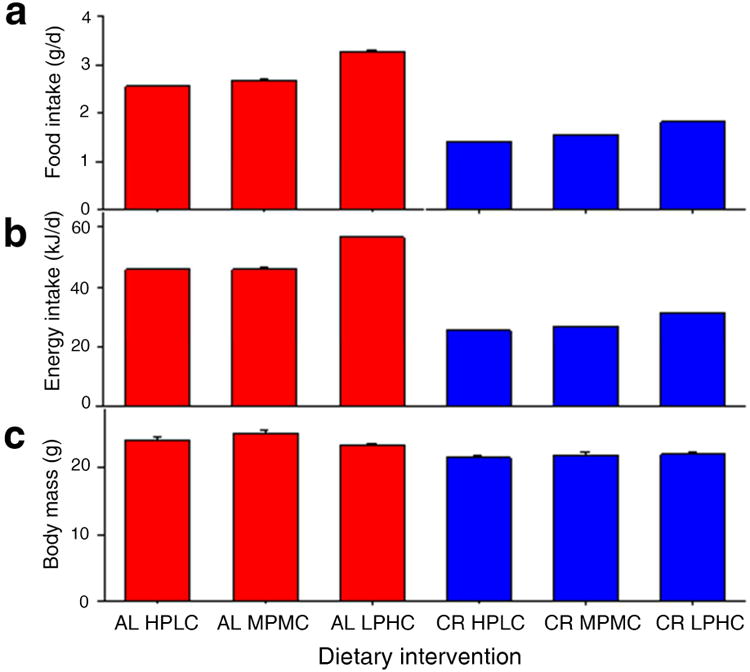
(a) Average food intake (g/day), (b) energy intake (kJ/day) and (c) body weight (g) over 8 weeks of feeding in AL and CR regimes. Note that CR animals were offered exactly 40% of AL counterparts fed the same diet composition (HPLC, MPMC or LPHC). See also Table S2.