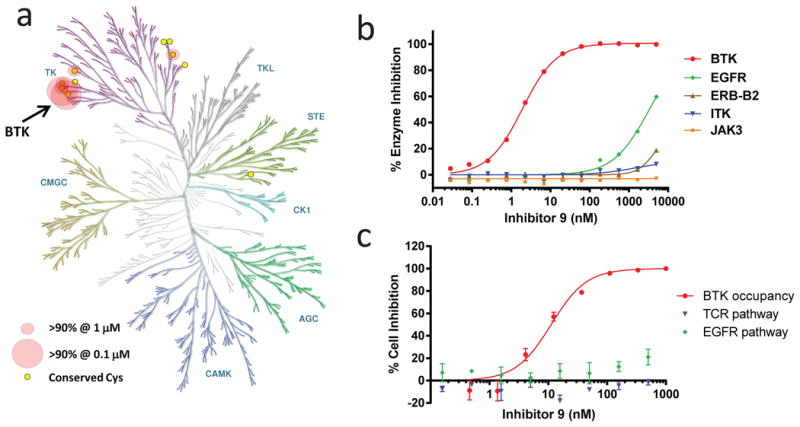
Figure 4. Kinase selectivity of inhibitor 9.

(a) Kinase selectivity of 9 evaluated at 1 μM and 0.1 μM in the Nanosyn 254 kinase panel. Circles indicate the 6 kinases that showed >90% inhibition at 1 μM. Large circles indicate the 2 kinases (BTK and BMX) that also demonstrated >90% inhibition at 0.1 μM. The figure was reproduced courtesy of Cell Signaling Technology, Inc. (www.cellsignal.com). (b) Enzymatic IC50 curves determined using inhibitor 9 toward BTK and other kinases with a homologous cysteine with known tissue-specific homeostatic roles in vivo (EGFR, ERB-B2, ITK, JAK3) (mean ± SD, n ≥ 2). IC50 values and curves toward the other related cysteine-containing kinases are shown in Supplementary Fig. 20. (c) Cellular selectivity of inhibitor 9. The activity of 9 in Ramos B cells using a BTK occupancy assay (see Supplementary Fig. 15) was compared with the activity toward ITK and EGFR in T cell receptor (TCR) and EGFR cellular reporter assays, respectively (mean ± SD, n ≥ 2). In the TCR assay, 9 was studied in a Jurkat T cell line stimulated with anti-CD3 plus anti-CD28 (to activate the T cell receptor pathway) and NFAT reporter expression was measured. In the EGFR assay, 9 was studied in ME-180 cervical carcinoma cells stimulated with EGF (to activate the EGFR receptor pathway) and AP-1 reporter expression was measured.
