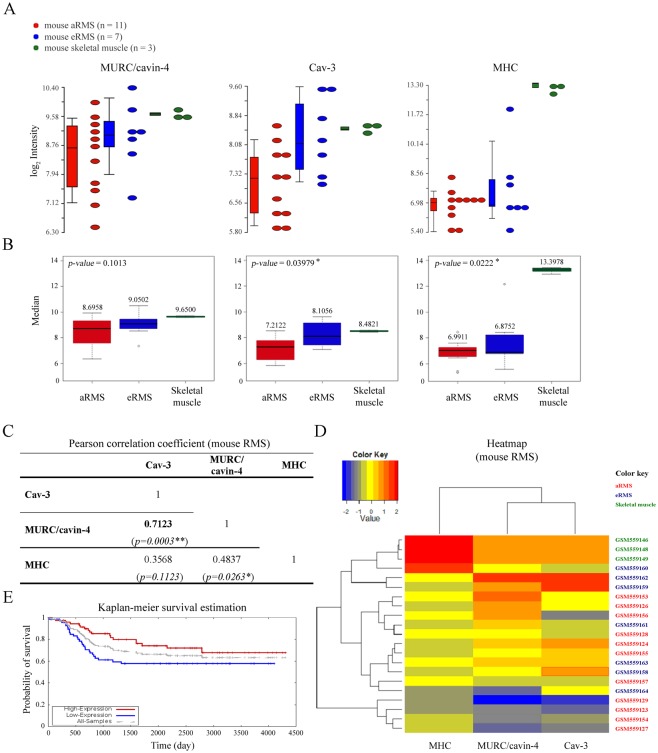
Fig 1. In silico analysis.
A) Dot-plots and bar charts representative of the transcript levels of MURC/CAVIN-4, CAV-3 and MHC genes in aRMS (n = 11) and eRMS (n = 7) vs skeletal muscle (n = 3) samples, as calculated after in silico analysis of microarray data. In the plot, each dot is a sample of the original data. The Y-axis represents the log2 normalized intensity of the gene and the X-axis represents the different types of samples. Bars represent the average ± standard error of the mean. B) MURC/CAVIN-4, CAV-3 and MHC transcript levels were represented with box-plots. MURC/CAVIN-4 gene was not differentially expressed between mouse aRMS and eRMS in comparison to skeletal muscle samples, as determined by Kruskal-Wallis test. p-values < 0,05 were used as criteria to evaluate significant difference in gene expression. In each box-plot the median value (black line in the box) is reported in correspondence of every subgroups. C) Heat map analysis on MURC/CAVIN-4, CAV-3 and MHC transcript levels in aRMS, eRMS and skeletal muscle samples. Low values of the gene expression are represented with blue, mean values are represented with yellow while high values are represented in red. D) Kaplan-Meier analysis was performed using microarray data from 139 primary human samples [54]. The overall survival in RMS patients with respect to Cav-3 expression is indicated with red and blue curve, respectively.

