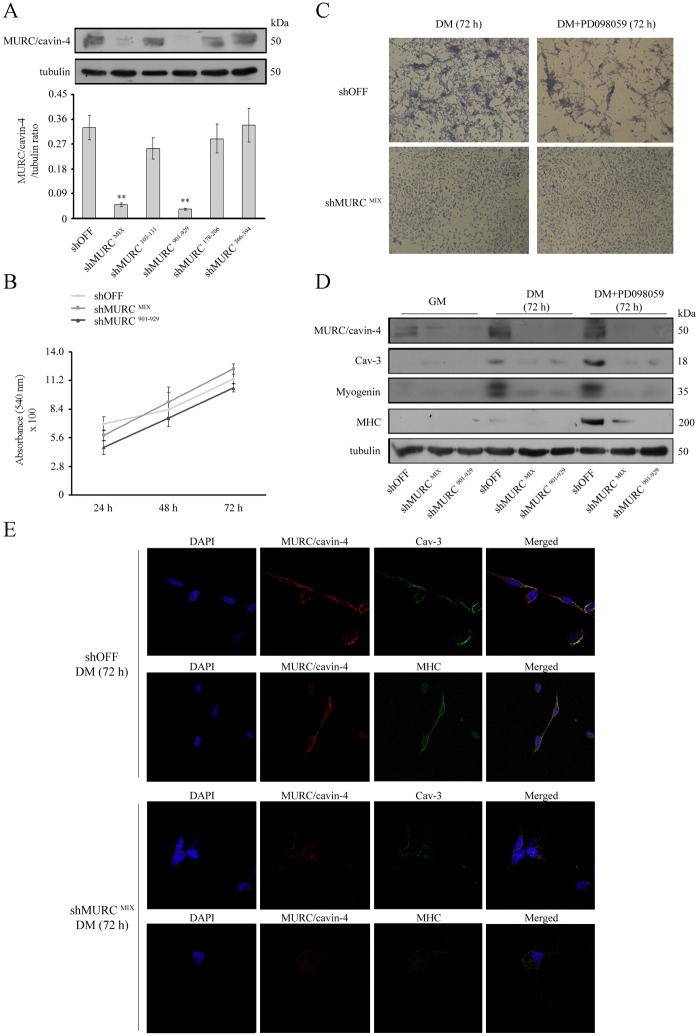
Fig 6. Effects of MURC/cavin-4 knockdown in the RD cell line.
Stably transfected RD clones (i.e., control shOFF and five different knock-down clones, namely shMURC MIX; 103–131; 901–929; 178–206; 366–394) were seeded in 60-mm dishes (at a density of 12 x 104) and harvested after 72 hours in GM. SDS-PAGE was carried out loading gel with 160 μg proteins per each sample and immunoblotting was performed to evaluate the protein levels of MURC/cavin-4. Results are representative of three independent experiments. Protein bands were quantified by densitometry after normalization with respect to tubulin (n = 3). **, P < 0.001. B) Crystal violet assay was employed to compare the proliferation over a time-course of 24-48-72 hours in knock-down MURC/cavin-4 clones (i.e., shMURC MIX and shMURC 901–929) and control shOFF clone. Results are representative of three independent experiments. C) Control shOFF and knock-down shMURC MIX cells were seeded in 60-mm dishes (at a density of 12 x 104) and, once reached the confluence, were differentiated in the presence of DM or DM added with 10 μM PD09859 for 72 hours. Giemsa staining was then employed to visualize the morphological differentiation. Pictures were taken under a phase contrast microscope at 40x magnification. Images are representative of three independent experiments. D) Under the same conditions, immunoblotting was performed to evaluate the protein content of MURC/cavin-4, Cav-3, myogenin and MHC. Results are representative of three independent experiments. E) Confocal microscopy analysis was employed to analyse the distribution of MURC/cavin-4 (red), Cav-3 (green) and MHC (green) in knock-down shMURC MIX clone as compared to control shOFF clone cultured in DM. Nuclei were counterstained with DAPI (blue). Samples were analyzed using a Zeiss LSM510 META microscope and pictures were taken with a 63x oil immersion objective.

