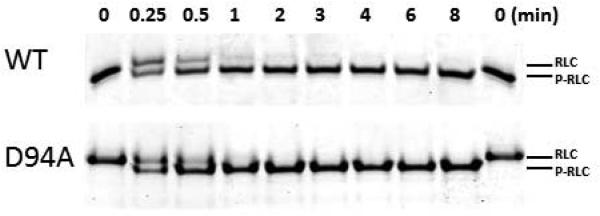
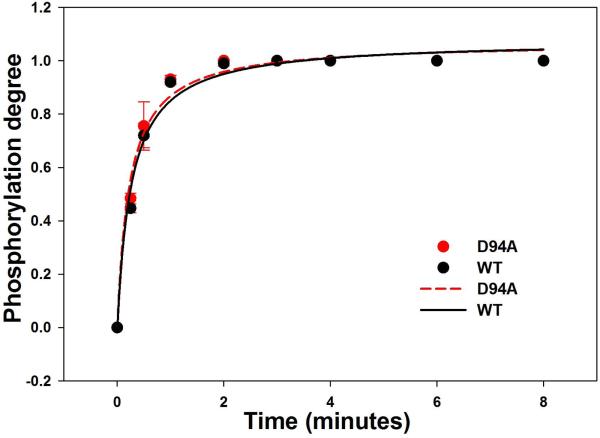
Figure 4.

A. Representative Urea-gel picture of the time course of phosphorylation of WT and D94A RLCs. Note a charge based separation of the phosphorylated (P-RLC) and non-phosphorylated RLC bands. B. Time course of MLCK-dependent phosphorylation of WT and D94A RLCs (0 to 8 minutes). Data points were fitted to Eq. 3 to generate phosphorylation kinetics rates (k). Note that both WT and D94A were phosphorylated with the rate of 1.1 min−1 (n=3 independent experiments) and reached the same maximal level of RLC phosphorylation.

