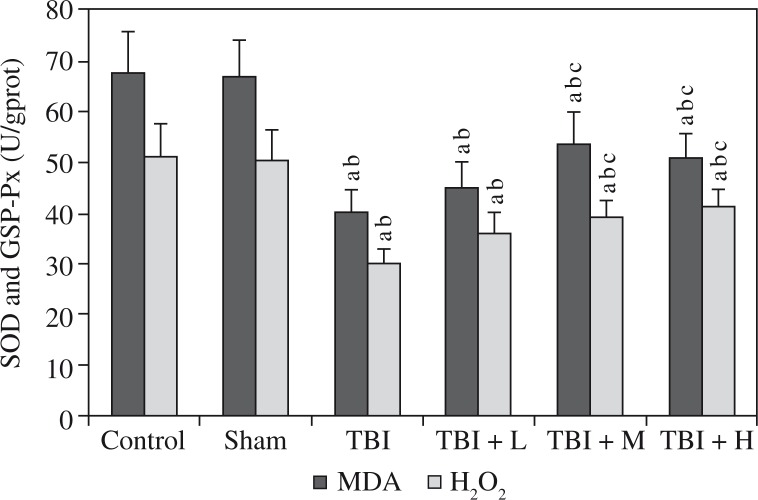
Fig. 4.
Effects of rhamnetin on anti-oxidative markers Control – control group; Sham – sham group; TBI – TBI group; TBI + L – rhamnetin low dose group; TBI + M – rhamnetin middle dose group; TBI + H – rhamnetin high dose group. The investigations were repeated 3 times and the 3 values of each animal were averaged. Data were expressed as mean ± SD (N = 10 per group) and analyzed using one-way ANOVA with subsequent SNK test. ap < 0.05, vs. the control group; bp < 0.05, vs. the sham group; cp < 0.05, vs. the TBI group

