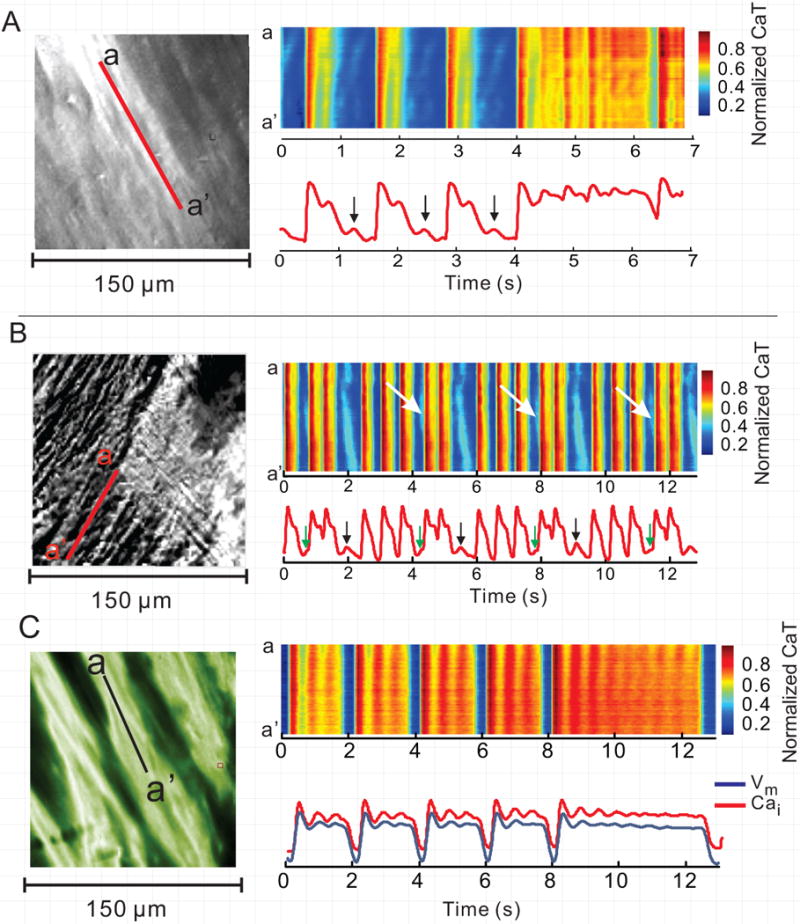
Figure 2.

High-resolution Ca2+ imaging displayed as pseudo line-scans in LQT2. A and B: The scan lines are identified by the red lines in the subcellular images in left most panels (field-of-view 150×150 μm). The diastolic Cai elevations (arrows) correspond to propagating waves, as evidenced by the oblique orientation of the corresponding pseudo line-scan feature. The systolic Cai oscillations are cell-synchronous, with vertical pattern on pseudo line-scan. C: An example of simultaneous subcellular Cai and Vm imaging. The pseudo line-scan again shows cell-synchronous systolic Ca2+ oscillations during the long CaTs. The simultaneous Cai and Vm tracings show that the corresponding Vm oscillations are less pronounced than CaT oscillations.
