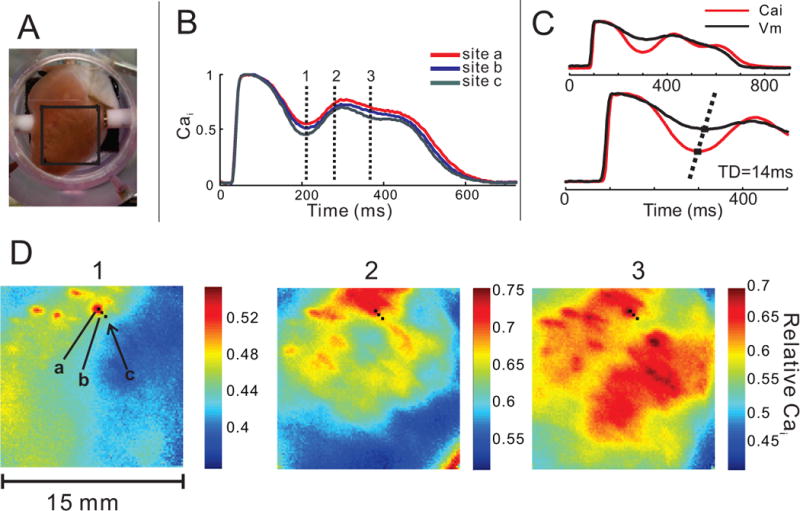
Figure 4.

Ca2+ dynamics in LQT2 at low resolution during paced rhythm. A: Field-of-view (15×15 mm) is selected on the anterior surface of the ventricles. B: Spatial heterogeneity (SH) of Ca2+ signal in LQT2 is evidenced by a different course of CaT in nearby pixels (a–c). The vertical lines (1–3) indicate the timing of the snapshots D1–D3. C: Superposition of AP and CaT from the same pixel show that the onset of the SSCE precedes the rise in membrane potential; the time delay, TD=14 ms in this example. D: SSCEs start to rise in several small (~ 0.5–1 mm) distinct areas (D1) that form isolated “islands” of Ca2+ elevation that spread and enlarge (panels D 2–3). The fluorescence intensity scale differs in these panels and in the corresponding Movie E to enhance the contrast of spatial heterogeneities of CaT on a millimeter-scale.
