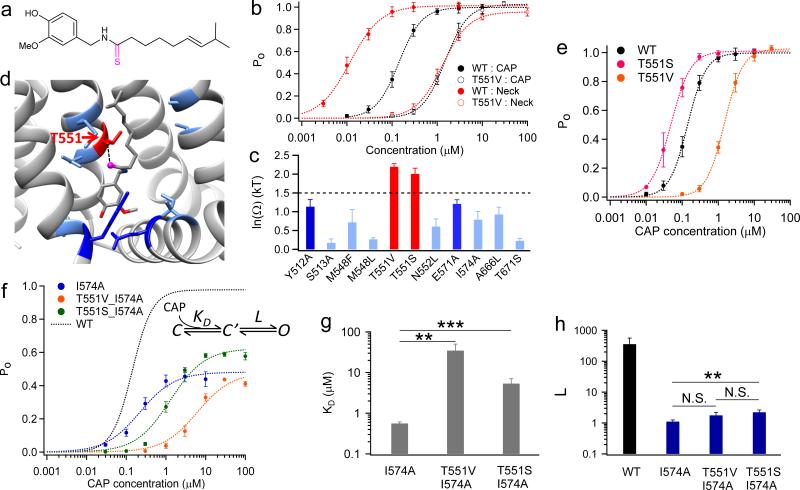
Figure 4. The Neck interacts specifically with T551.
(a) Chemical structure of the capsaicin analog (Compound 8) with an altered Neck structure. (b) Representative concentration-response curves using analog in (a) and T551. (c) Summary of coupling energy at nine residues. Residue with coupling energy larger than the 1.5 kT threshold is colored in red. At least four independent trials were performed for each chemical at each concentration. (d) Coupling energy is mapped onto the binding pocket. Color scheme is the same as in (c). The oxygen atom of the Neck, which is changed in the analog in (a), is presented as ball-and-stick in magenta. (e) Concentration-response curves of TRPV1 WT, T551V and T551S. (f) Gating scheme of ligand binding and channel gating and concentration-response curves of double mutants T551V_I574A (colored in orange) and T551S_I574A (colored in green). (g and h) Comparison of KD (g) and L (h) values of mutants. L of WT was determined from Po_max by single- channel recordings as . N.S., **, and *** denote P > 0.05, P < 0.01, and P < 0.001, respectively. All statistical data are given as mean ± SEM.

