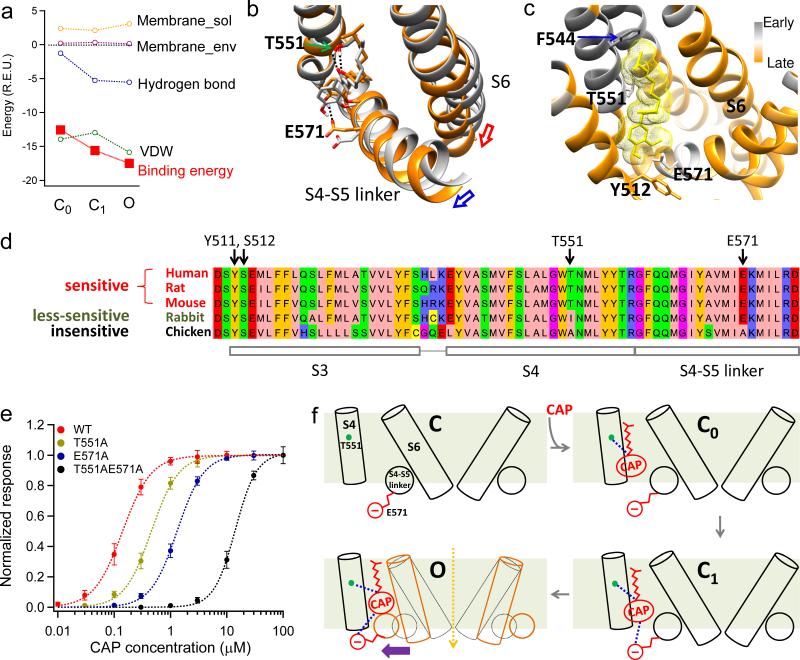
Figure 6. Mechanisms for capsaicin induced channel activation.
(a) Components and total binding energies calculated from the initial closed state (C0), second closed state (C1) and open state (O), respectively. For each state, energy decomposition was done by applying Rosetta's residue_energy_breakdown utility to the docking model (see Online Methods for details). (b), Capsaicin-induced conformational changes between C0 (grey) and O (orange) states. Hydrogen bonds are indicated by black dotted lines. Capsaicin goes deeper into its binding pocket in O state. (c) fprogress values calculated by iNEM modeling are mapped onto the capsaicin binding pocket. Residues moving early are colored in grey, while those moving late are colored in orange. Residues that may interact with the Tail of capsaicin such as F544 move relatively early, indicating the Tail contacts the binding pocket first. Lower S6 segment moves late as it forms the activation gate, which opens after capsaicin binding. Y512 cradles capsaicin inside the binding pocket in the open state, so it also moves late. (d) T551 and E571 are key residues responsible for species difference in capsaicin sensitivity. Protein sequences of TRPV1 in five species with known capsaicin sensitivity are aligned by AlignX in Vector NTI Advance suite and visualized by Jalview47 with Zappo color scheme. (e) Concentration-response curves of TRPV1 WT, T551A, E571A and T551A_E571A. (f) A schematic diagram summarizing capsaicin binding and activation of the channel. All statistical data are given as mean ± SEM.

