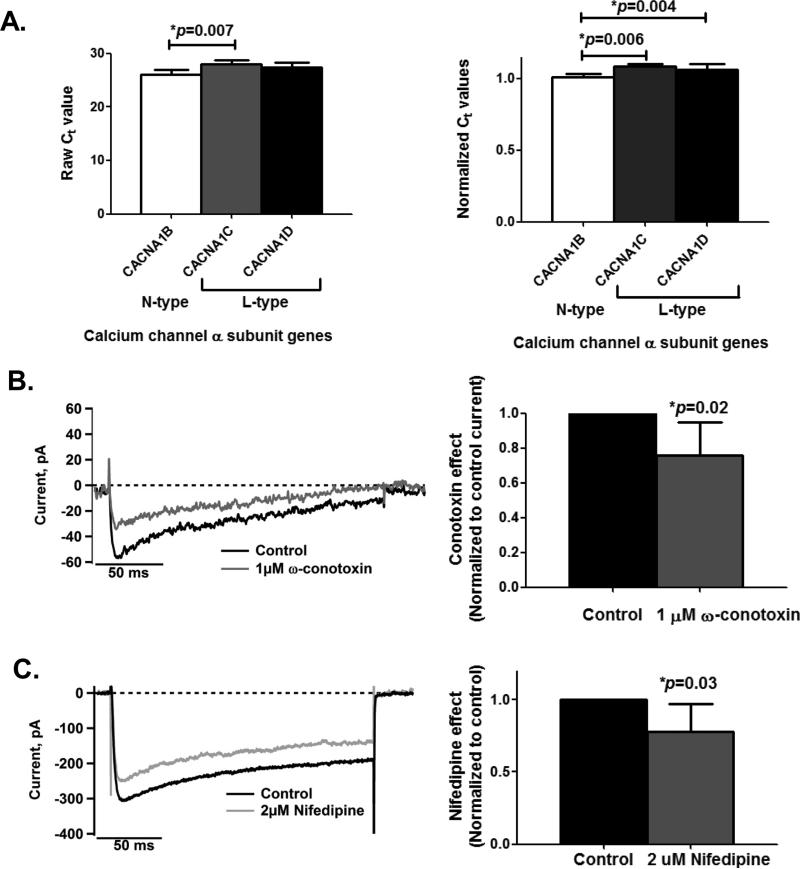
Figure 1. L- and N-type voltage-gated Ca2+ channels are expressed in the differentiated human cell line SH-SY5Y.
A. qPCR analyses indicate that CACNA1B gene (n=5), which encodes for the N-type Ca2+ channel, has lower expression levels than L-type Ca2+ channel genes, CACNA1C (n=5) and CACNA1D (n=5) (Normalized Ct ANOVA, p=0.005). The Ct values from qPCR raw measurements (left panel) and the normalized Ct values (right panel) are shown. Note that Ct values are inversely proportional to the RNA levels in the samples. Total RNA was extracted from harvested cells 48 hours after plating. Group means were statistically compared using 1-way ANOVA with Bonferroni's Multiple Comparison Test.
B. Whole-cell patch clamp recordings from a representative cell (left panel) and from a group of cells (n=5; right panel) show partial suppression of inward Ca2+ currents when cells are exposed to 1μM ω-conotoxin solution, inhibiting N-type Ca2+ channels by 24.4±19SD% (paired t-test, p=0.02). Current inhibition at this non-saturating dose was maximal within 3-5 minutes after application of toxin.
C. As in 1B, treatment with 2μM nifedipine, a selective blocker for L-type Ca2+ channels, also shows inhibition of inward Ca2+ currents by 22±19SD% (paired t-test, p=0.03) based on whole-cell recordings from a representative cell (left panel) and from a group of cells (n=6; right panel). Currents at this non-saturating dose were suppressed within 1-2 minutes after application of nifedipine.
In 1B and 1C, inward currents are evoked by a depolarizing step to +30mV for 200 ms from a holding potential of -90mV. Group comparisons are from cells each having been exposed to both control solution and a solution supplemented with one of the blockers. Control solution is selective for recording of Ca2+ currents (see Methods).

