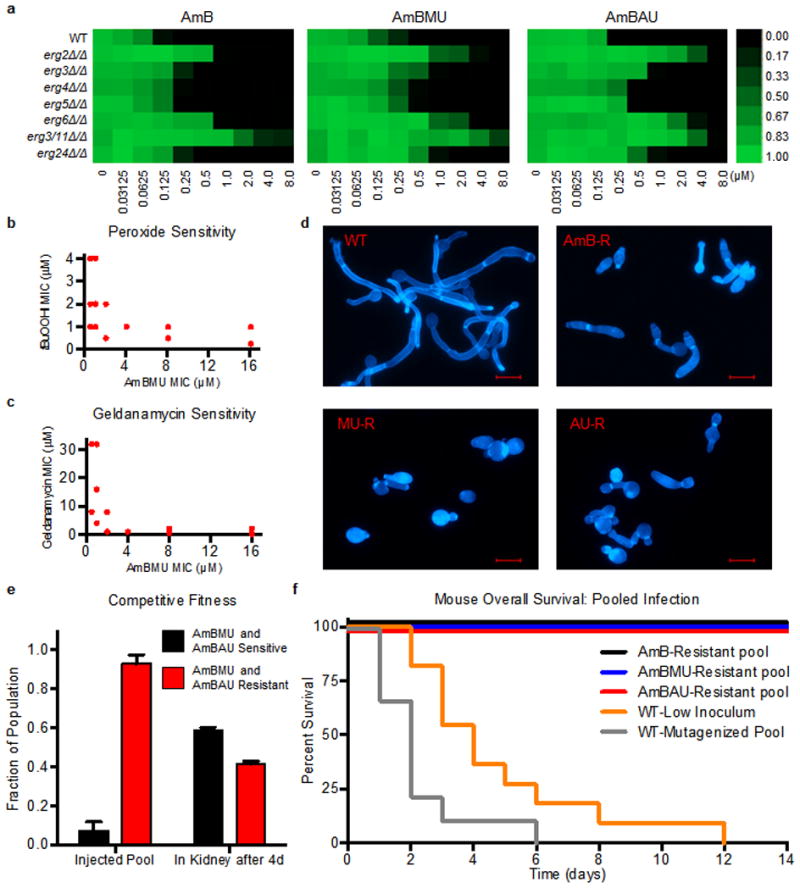
Figure 4. Characterization of mechanisms and costs of resistance to AmB ureas.

a. Activity of AmB, AmBMU and AmBAU against C. albicans ergosterol biosynthesis mutants. Growth (as judged by OD600 at 24 h) is shown relative to WT with no compound added. Scale bar indicates relative growth ranging from bright green (equal to WT growth, 1.00) to black (zero growth, 0.00). b,c. MIC of tert-butyl peroxide and geldanamycin compared to AmBMU for all resistant isolates selected; each point indicates one or more isolates. d. Filamentation in response to serum at 37°C. Representative images of wild-type and mutants selected in AmB, AmBMU or AmBAU, (all cross-resistant), stained with Calcofluor White. Scale bar = 10 μm e. Competitive infection of mice with 16 different strains (1 WT and 15 that are resistanct to AmBMU and AmBAU). 3×10⁴ cells of each strain injected per mouse (4.8×10⁵ total inoculum). Fraction of pool sensitive or resistant to AmBMU and AmBAU determined before tail-vein injection and 4d later after isolation from kidneys. f. Mouse overall survival after tail-vein injection. Mice were injected with a pool of 5 passaged and mutagenized WT strains each at 1.6×10⁵ (8×10⁵ total inoculum), 1.6×10⁵ cells of parental WT (WT-Low), or pools of 5 resistant mutants with 1.6×10⁵ cells of each mutant.
