
Figure 3.
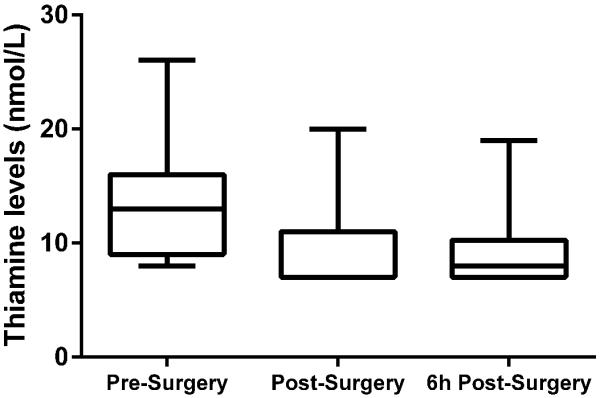
Thiamine levels before and after the surgery. The box plots represent minimum, 1st quartile, median, 3rd quartile and maximum. There was a significant change in thiamine over time (p < 0.001).
Official websites use .gov
A
.gov website belongs to an official
government organization in the United States.
Secure .gov websites use HTTPS
A lock (
) or https:// means you've safely
connected to the .gov website. Share sensitive
information only on official, secure websites.
Thiamine levels before and after the surgery. The box plots represent minimum, 1st quartile, median, 3rd quartile and maximum. There was a significant change in thiamine over time (p < 0.001).