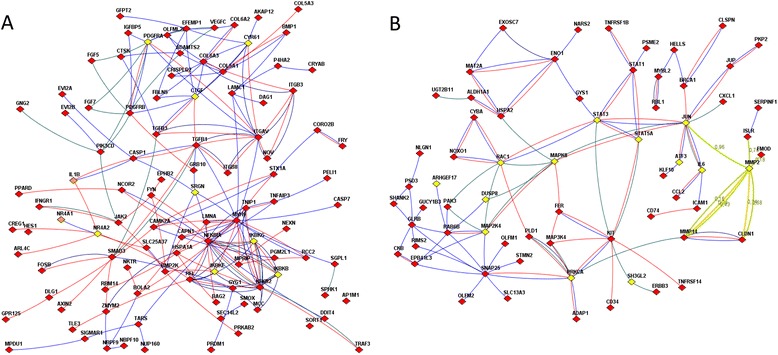
Fig. 4.

Functional relations of differentially expressed genes with each other and with members of important pathways, as displayed by FunCoup online resource [14]. a Genes differentially expressed under confrontation with tumor cells and pathway members. Nodes: Yellow, genes of the proinflammatory signature [27], and/or YAP/TAZ cascade [25], and/or Hippo pathway [26]. Red, confrontation-specific DEGs. Orange: genes that belong to both “yellow” and “red” categories Line color denotes origin of FunCoup evidence for the network edges (see also “Global interaction network” in Methods): Red, protein-protein interactions. Blue: co-expression of mRNA. Deep green: links in a KEGG pathway. Multiple lines between the same two nodes indicate that multiple lines of evidence and were treated as single edges in NEA. Lines with FunCoup confidence <0.1 for the individual component are not shown. b Genes differently expressed between 4 most and 4 least inhibitory fibroblast cultures before confrontation and pathway members. Yellow: the RhoA signaling pathway by PID database [30] and pathway for RhoD regulation of cytosceletal dynamics via WHAMM [31]. Red, DEGs between inhibitory and non-inhibitory fibroblast samples. The the line color, see the legend in A
